Innovative data aggregators, organizations, and scientists are applying different types of analytic techniques such as investigative data discovery, descriptive data aggregation, predictive analytics focused on outcomes, and other prescriptive techniques. Figure 1 shows a framework for analytics in agronomy. The framework is designed to enable architecturally significant use cases, including:
- Reporting. Farming operations require daily/periodic reports on a number of topics, including weather, grower and subcontractor results, and information required to follow up on planning versus actual activities. Such reports support regular farm operations and help with planning of future activities. Farms also have to maintain reports and data on seeds and applications of pesticides, herbicides, insecticides, and other treatments. Such reports are needed for cost and yield analysis and may also be required for inspection by federal and state farming regulatory authorities.
- Dashboards. The other major reporting capability is to enable dashboards for visualization and analysis. This includes dashboards for planning activities like crop planting and diagnostics of factors that could impact the quality and yield performance. Data and images gathered from satellites, drones, and sensors can also be visualized against field-level coordinates to observe the progress of crop growth and plan any required course corrections. Farmers may also require the ability to extract and transmit such data to agronomists and other advisors.
- Discovery. Support for predictive analytics is another major capability being designed into the agronomy framework to enable diagnostics and search and data exploration. Such predictive analytics require historical data to observe variance between recommended and actual yields and other limiting factors. For example, analysis of the data may highlight a farm plot that consistently yields better results than others in the vicinity that don’t get similar inputs. The farmer and agronomists can then drill down and review other factors regarding the plot to understand this positive variance and whether it can be replicated across the farm.
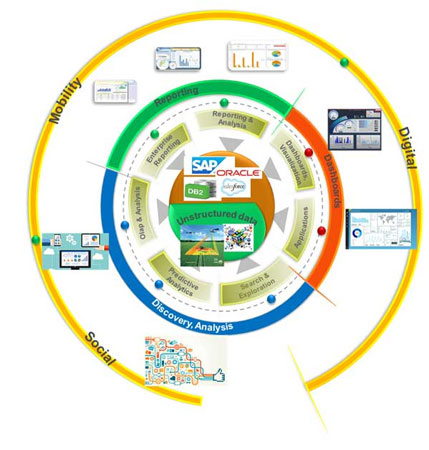
Figure 3 — A framework for analytics in agronomy.
Dashboards enabled by predictive analytics are already starting to pay dividends in farming operations. For instance, a recent Reuters article quotes farmer Juergen Schwarzensteiner, who rotates corn, potatoes, and grains at a 970-hectare farm in Bavaria using satellite maps and analytics software: “This plot has had top yields consistently over the years, [and] I used to just say, that’s great.... Then we got the digital maps, and differences became apparent that were not clear to the eye before.” Using digital dashboards, farmers like Schwarzensteiner are able to view color-patterned digital maps that highlight discrepancies in plants growing in plots across fields even half a mile apart. Such dashboards “aim to provide farmers with individualized prescriptions on how to work each field down to a fraction of an acre, using data they have collected on soil and weather conditions.”
At the core of the framework are structured and unstructured data sources. Agribusiness organizations, government agencies, and other research organizations generate reports and transactional data in formats that can be stored and retrieved from relational, structured databases. Such transactional and reference data may exist in databases within software applications running commercially developed databases like IBM’s DB2, Microsoft’ SQL Servers, or Oracle. Such data can be cataloged, indexed, and queried using well-understood tools and techniques.
Social media, satellites, drones, and sensors also generate vast amounts of unstructured and big data that may include images, text, and other data structures. Emerging big data analytic techniques are being applied to make sense of this data. Traditionally, farmers have applied new techniques — such as new seeds, pesticides, herbicides, and so forth — to a small plot to observe optimal yields. Instead of such empirical analysis, which takes time, farmers are also embracing results from analysis of large, real-world data sets from public sources. Analysis of such big data can produce reliable recommendations much more quickly.
An article from the International Center for Tropical Agriculture illustrates how scientists at the center have applied big data tools to pinpoint strategies that work for small-scale farmers in a changing climate:
Big Data on Colombian rice comes from commercial fields in ambient weather, a stark departure from other research.... With good analytics, this produces nuanced, reliable recommendations much more quickly. It also gives rice breeders the feedback they need to develop climate-adapted lines.
Data aggregated from different sources needs to be analyzed, visualized, and used for reporting. Such data may be designed to persist in reporting tools temporarily or in a fit-for-purpose data warehouse designed for agronomic reporting. For instance, a large farming operation, with hundreds of acres of land spread over a large geographic area may benefit from analysis of aggregated data, especially if trends from one field can predict outcomes in other fields. The aggregated data also needs to be localized. Rick Murdock, head of Ag Connections, a wholly owned subsidiary of Syngenta, explains: “We believe spatial agronomic recommendations are local and need to be driven by local retail agronomists, consultants, or grower agronomists: We know crops grow best when they are seen by the agronomist!”
Many of the techniques and solutions highlighted in the framework, including tools for data analysis, reporting, visualization, and aggregating big data with data across disparate sources, are already available. These are being used in other industries and to solve individual agronomy problems. The challenge is to aggregate data from disparate sources in different formats to draw inferences. Among the difficulties in aggregating data from different sources is the need to clean the data. A few key assumptions on data cleansing include:
- Data is generally not cleansed at the source or during the data collection stage. It is assumed that such data from different organizations and source systems is formatted and referenced according to its individual requirements. The data may not be designed with a common taxonomy, and even the metadata and units of measure may be different.
- Data cleansing could be done using automated methods, but this requires some manual effort and standardization of business rules. Data analysts need to understand the sources of the data, data definitions, and metadata, and based on such understanding, they can plan to translate and cleanse the data after retrieval.
- Cleansed data can be stored as published data for various visualization or analytical purposes. Such cleansed data may have to be reviewed periodically, as it might go stale.
[For more from the author on this topic, see "Enabling Agronomy Data and Analytical Modeling: A Journey."]