
CUTTER IT JOURNAL VOL. 29, NO. 6
![]()
Agriculture is among the oldest vocations known to mankind. Traditionally, a farmer’s decision making is grounded in human knowledge and intelligence that comes from experience (analysis of historical data), intuition (predictive modeling), and insights from such analysis (visualization of such data with recipes and formulas). Agriculturalists are increasingly moving away from depending on empirical knowledge toward working with modern tools and techniques grounded in data and analytical modeling. Such tools and techniques are modernizing the decision making and enabling increasing yields and revenue for farmers.
Farmers and the agricultural companies that service their needs deal with vast amounts of structured and unstructured data. Analysis of such data gathered from across a variety of growers and growing conditions, combined with data from other sources — including satellite and drone imaging, field-level sensors, weather, and other historic data — can provide insights to enable farmers to make timely decisions that can improve their yields and minimize losses due to unpredictable changes in weather.
In this article, I will examine the fast-changing landscape of agronomic data gathering and modeling. I will also look at the enablers for the following kinds of analytics, which require different data inputs and quality of data:
- Investigative (discovery)
- Descriptive (aggregation)
- Predictive (outcomes)
- Prescriptive (available options)
I will also evaluate data integration capabilities required to deliver these analytical capabilities. Gathering such data for decision making is not a trivial challenge that can be addressed with a single solution; rather it is a journey that aims to provide farmers with tools for decision making. I will also highlight some observations and learnings for those striving to enable data for analytics and modeling in agriculture.
Data and Technology Aiding Agriculture
Technology is pervasive in almost all aspects of modern agriculture — from the time a farmer plans the crops for the season, and even after the crops are harvested and leave the farm, through marketing and distribution. At the time of planning crops for the growing season, the farmer takes into account key agronomy inputs, including the long-term weather forecast (when do I plant my crops?), grain price forecast from futures markets (what crops do I plant?), availability of new agriculture technology, including quality seeds and agro-chemicals such as pesticides, herbicides, and insecticides (what technologies do I use to maximize my yields?). To answer some of these questions, the farmer also has to consider other basic inputs like the available land acreage, access to irrigation, and the labor and resources at his or her disposal.
Farmers realize they have enormous amounts of data at their disposal, but they also recognize that analysis of data is not their core competence. They need tools, technologies, and advice to interpret the data that can enable them to make timely decisions. Figure 1 highlights some typical questions for which farmers need answers in order to enable planning during a growing season.
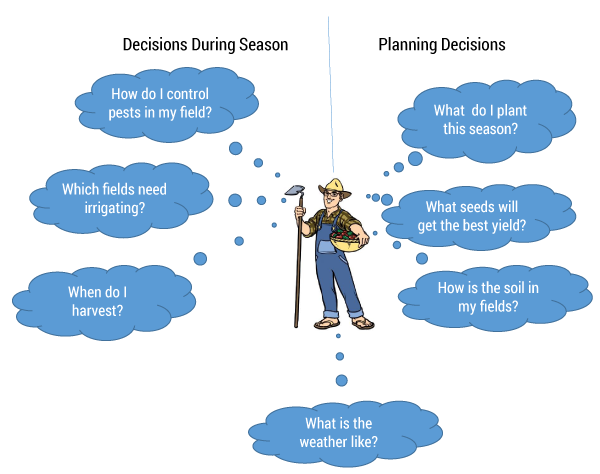
Figure 1 — A sampling of the questions that drive decisions.
During the growing season, farmers have to continually monitor their fields. The popular “Farm Forward” video from John Deere takes a futuristic view of technologies by integrating information “just in time” for decision making. Many of the technologies highlighted are already being adopted in farming, although end-to-end integration of individual solution components and data sources remains a challenge.
In addition to physical monitoring and surveying, farmers are aided by sensing technologies and data feeds from satellites and drones. Structured and unstructured big data from such an Internet of Things (IoT) at farms is increasingly being used to answer questions that may not be intuitive for individuals. For example, the recent case study “Connected cows help farms keep up with the herd” highlights an innovative case:
SCR Dairy now has about 4 million tags connected to cows around the world, monitoring their activity and wellbeing 24 hours a day. The data generated from the tags is transferred to management solutions that help farmers make better decisions, as well as providing alerts.
“We have alerted farmers of cows having, for example, a prolonged calving, or a difficult labor, in the middle of the night,” says Matteo Ratti, vice president of SCR’s Cow Intelligence business. “They were able to go out and save the cow. With this technology, farmers get the information they need to manage the herd more efficiently.”
During the growing season, farmers also need to continually respond to changes in weather, rainfall, and increase of pests, weeds, and other factors that can impact the growth and yield. On a large farm, the farmer might have to take action on a field level by increasing or reducing irrigation and managing the application of pesticides, herbicides, and insecticides in a controlled manner.
Decision Support Systems in Agronomy
Decision support systems for agronomy take a few fundamental factors as inputs, some of which are within the control of farmers and many which are outside their control. Figure 2 highlights some of the key decisions.
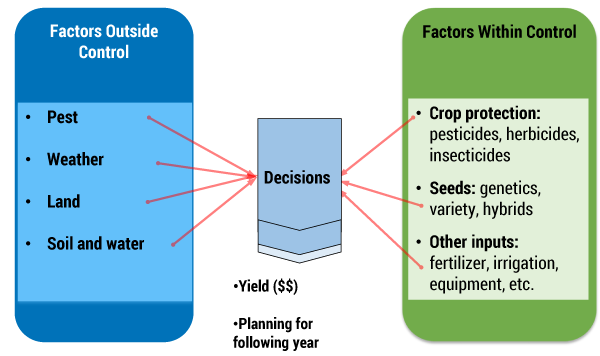
Figure 2 — Inputs for decision support systems.
Providing field-specific advice to growers requires aggregating, analyzing, and tailoring agronomy data based on inputs that include local soil, crop variety, weather and environmental conditions, pests, and other inputs. Technology firms across a broad spectrum of the agriculture industry are attempting to aggregate such data from public and corporate sources. A recent Farm Industry News article highlights major American companies with solutions for real-time farm management and agronomy.
The goal of most agronomy solutions is similar: they aim to provide field-specific advice, tailored to local soil, crop variety, weather, pests, and environmental conditions for farmers. However, in order to provide such tailored advice, field-by-field data needs to be gathered from the growers and captured in a model, designed in the agronomy solution. In addition, data from external sources, including weather data and forecasts and other agronomic inputs from public sources, needs to be gathered. The end result is a recommendation on potential yields and planning for the following year.
Opportunities in Data and Analytics
Enabling field-specific advice localized to individual farms and farmers requires the design of processes and systems that can take inputs from structured and unstructured data sources. Such data, when aggregated and analyzed, can provide timely insights and recommendations.
There is a confluence of forces impacting the way consumers interact with information technology, including what some in the industry collectively call SMAC — social, mobile, analytics, and cloud. SMAC is also being seen as an opportunity in agribusiness as companies, government organizations, and others interact with and influence farmers and growers. Agricultural research institutions, government agencies (like the US Department of Agriculture), and agribusiness companies actively engage with farmers using social media accounts on Facebook, Twitter, LinkedIn, and so on. Many of these accounts are supported by people and infrastructure to provide timely crop and region-specific information on weather, pests, and other factors that farmers watch closely. These social media accounts become really active during the growing season.
Farmers, especially in Western economies, have been early adopters of social media as they engage and interact with others via tweets, knowledge-sharing blogs, Facebook groups, and other online forums using their mobile devices. Farms operate outside of urban hubs and may not have the best network and broadband access, but this has not constrained the adoption of SMAC tools and technologies. Rural communities, especially in developed economies, are increasingly deploying their own Internet network connections and hubs. In developing economies like India, SMAC also includes the use of more pervasive technologies like SIM cards on low-end cellphones. A recent Ars Technica article highlights how SMS technology is being used: “the device leverages the core functions of a SIM card (transmitting calls and texts) to deliver free voice messages to farmers, offering updates relating to growing and selling crops.”
Modern agriculture has long relied on weather and agronomy data gathered from satellites, weather stations, and other publicly managed platforms. Such information, gathered from government, research institutions, and other public sources, has been made available to growers freely. Design of analytics and agronomy decision support systems require deeper understanding of agriculture data available from public, corporate, and farm data sources:
- Corporate agronomy data. Information on sales and marketing, pests, and agronomic inputs are constantly analyzed by organizations involved in the production and supply of seeds and crop protection chemicals.
- Farm data. Individual farms and farmers generate a lot of data from their operations, including data on their land, soil, seeds, chemical, fertilizer, water, and other inputs used during the growing season; agronomic protocols they have adopted; and details of their crop and historic yield, along with local growing conditions.
- Public data. Public data (including data from national, state, and local government agencies), weather and agronomy data, market analysis and forecasts, and other information may either be available freely or sourced from data aggregators.
- Emerging data. Adoption of consumer-centric uses of the IoT continue to await mass adoption, but farmers are already beginning to leverage data from farm-based sensors and drones.
Integrating data from across traditional and emerging data sources requires an understanding of data formats, types, frequency, aggregation, and translation of such data. Rules and regulations with respect to data ownership and stewardship — especially of farm-specific data — vary across countries, states, and provinces. Therefore, agronomy data scientists also need to be cognizant of regulatory requirements that guide the storage, aggregation, and retrieval of such data.
A Framework for Analytics in Agronomy
Innovative data aggregators, organizations, and scientists are applying different types of analytic techniques such as investigative data discovery, descriptive data aggregation, predictive analytics focused on outcomes, and other prescriptive techniques. Figure 3 shows a framework for analytics in agronomy. The framework is designed to enable architecturally significant use cases, including:
- Reporting. Farming operations require daily/periodic reports on a number of topics, including weather, grower and subcontractor results, and information required to follow up on planning versus actual activities. Such reports support regular farm operations and help with planning of future activities. Farms also have to maintain reports and data on seeds and applications of pesticides, herbicides, insecticides, and other treatments. Such reports are needed for cost and yield analysis and may also be required for inspection by federal and state farming regulatory authorities.
- Dashboards. The other major reporting capability is to enable dashboards for visualization and analysis. This includes dashboards for planning activities like crop planting and diagnostics of factors that could impact the quality and yield performance. Data and images gathered from satellites, drones, and sensors can also be visualized against field-level coordinates to observe the progress of crop growth and plan any required course corrections. Farmers may also require the ability to extract and transmit such data to agronomists and other advisors.
- Discovery. Support for predictive analytics is another major capability being designed into the agronomy framework to enable diagnostics and search and data exploration. Such predictive analytics require historical data to observe variance between recommended and actual yields and other limiting factors. For example, analysis of the data may highlight a farm plot that consistently yields better results than others in the vicinity that don’t get similar inputs. The farmer and agronomists can then drill down and review other factors regarding the plot to understand this positive variance and whether it can be replicated across the farm.
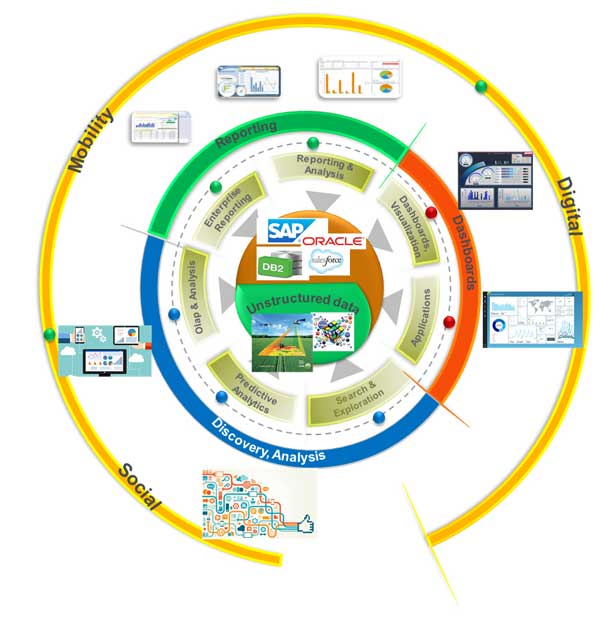
Figure 3 — A framework for analytics in agronomy.
Dashboards enabled by predictive analytics are already starting to pay dividends in farming operations. For instance, a recent Reuters article quotes farmer Juergen Schwarzensteiner, who rotates corn, potatoes, and grains at a 970-hectare farm in Bavaria using satellite maps and analytics software: “This plot has had top yields consistently over the years, [and] I used to just say, that’s great.... Then we got the digital maps, and differences became apparent that were not clear to the eye before.” Using digital dashboards, farmers like Schwarzensteiner are able to view color-patterned digital maps that highlight discrepancies in plants growing in plots across fields even half a mile apart. Such dashboards “aim to provide farmers with individualized prescriptions on how to work each field down to a fraction of an acre, using data they have collected on soil and weather conditions.”
At the core of the framework are structured and unstructured data sources. Agribusiness organizations, government agencies, and other research organizations generate reports and transactional data in formats that can be stored and retrieved from relational, structured databases. Such transactional and reference data may exist in databases within software applications running commercially developed databases like IBM’s DB2, Microsoft’ SQL Servers, or Oracle. Such data can be cataloged, indexed, and queried using well-understood tools and techniques.
Social media, satellites, drones, and sensors also generate vast amounts of unstructured and big data that may include images, text, and other data structures. Emerging big data analytic techniques are being applied to make sense of this data. Traditionally, farmers have applied new techniques — such as new seeds, pesticides, herbicides, and so forth — to a small plot to observe optimal yields. Instead of such empirical analysis, which takes time, farmers are also embracing results from analysis of large, real-world data sets from public sources. Analysis of such big data can produce reliable recommendations much more quickly.
An article from the International Center for Tropical Agriculture illustrates how scientists at the center have applied big data tools to pinpoint strategies that work for small-scale farmers in a changing climate:
Big Data on Colombian rice comes from commercial fields in ambient weather, a stark departure from other research.... With good analytics, this produces nuanced, reliable recommendations much more quickly. It also gives rice breeders the feedback they need to develop climate-adapted lines.
Data aggregated from different sources needs to be analyzed, visualized, and used for reporting. Such data may be designed to persist in reporting tools temporarily or in a fit-for-purpose data warehouse designed for agronomic reporting. For instance, a large farming operation, with hundreds of acres of land spread over a large geographic area may benefit from analysis of aggregated data, especially if trends from one field can predict outcomes in other fields. The aggregated data also needs to be localized. Rick Murdock, head of Ag Connections, a wholly owned subsidiary of Syngenta, explains: “We believe spatial agronomic recommendations are local and need to be driven by local retail agronomists, consultants, or grower agronomists: We know crops grow best when they are seen by the agronomist!”
Many of the techniques and solutions highlighted in the framework, including tools for data analysis, reporting, visualization, and aggregating big data with data across disparate sources, are already available. These are being used in other industries and to solve individual agronomy problems. The challenge is to aggregate data from disparate sources in different formats to draw inferences. Among the difficulties in aggregating data from different sources is the need to clean the data. A few key assumptions on data cleansing include:
- Data is generally not cleansed at the source or during the data collection stage. It is assumed that such data from different organizations and source systems is formatted and referenced according to its individual requirements. The data may not be designed with a common taxonomy, and even the metadata and units of measure may be different.
- Data cleansing could be done using automated methods, but this requires some manual effort and standardization of business rules. Data analysts need to understand the sources of the data, data definitions, and metadata, and based on such understanding, they can plan to translate and cleanse the data after retrieval.
- Cleansed data can be stored as published data for various visualization or analytical purposes. Such cleansed data may have to be reviewed periodically, as it might go stale.
Conclusion
In this article, I have discussed some of the traditional and emerging data analysis and analytic techniques being applied to enhance decision making in farming. Farms operate in a variety of topographies, weather conditions, and geographies across the globe. Farms also operate at a variety of scales, ranging from small subsistence farms to mega farms spanning thousands of hectares. Given the variety of conditions where farms operate, frameworks for tools and technologies to support analytics in agronomy need to be customized to specific requirements, which is an ongoing journey.
I also introduced a framework for generating localized advice and information for individual farms based on data gathered from public and corporate data sources. Current advancements and digitization in agronomy are geared toward increasing yields at large farms that specialize in a few key field crops. Such farms also have the means at their disposal to invest in tools, technologies, and data gathering. I believe that such an agronomy framework will eventually scale down to benefit small-scale and subsistence farming practiced in developing economies as well.
Agribusiness companies thrive by identifying optimal agronomic conditions to provide better yields for their customers, the farmers. Such advice had been based on the empirical knowledge of individual agronomists and researchers. Now these companies have begun leveraging insights based on analytics of data from field trials, crop properties, and other agricultural inputs to identify solutions that can provide consistent and optimal yields. Identifying and leveraging such insights to advise farmers also makes good business sense: growers who enjoy consistently high yields are willing to pay a premium for crop protection chemicals and high-quality seeds.
HYVIDO® barley is one of the first solutions from Syngenta to be backed by a Cashback Yield Guarantee. Based on extensive reviews of field trial data, weather, protocols, and other grower inputs, it was determined that optimal use of HYVIDO barley solution can guarantee a yield increase for growers. Thus, the company is able to offer a guarantee backed by data and analytics. The proposal offers a cashback guarantee, about £60/hectare (approximately US $32/acre), to ensure a half-ton yield boost from growing hybrid winter barley. Growers who sign up for the program get a £60/hectare refund on Syngenta’s HYVIDO hybrid barley varieties if certain agronomic conditions are fulfilled.
Other agribusiness companies like Monsanto have also rolled out risk management and yield assurance tools. For instance, Monsanto’s Biotech Yield Assurance Program for Farmers, “links an insurance policy to the yield benefits of Genuity® Roundup Ready 2 Yield® soybeans, Genuity SmartStax,™ and SmartStax™ corn.”
The genesis of such “crop yield guarantee” solutions lies in extensive analysis of digital agronomy data, including historical yields, data from reference farms, and other inputs. Based on such analysis, agribusiness firms may determine that use of the prescribed protocol can lead to a better yield, in turn generating higher returns for growers. The goal is to try to replicate such success for other crops in other regions around the globe.
Acknowledgment
I would like to acknowledge my colleagues Stephen Smith and Amar Singh for ideation and research for this article.