
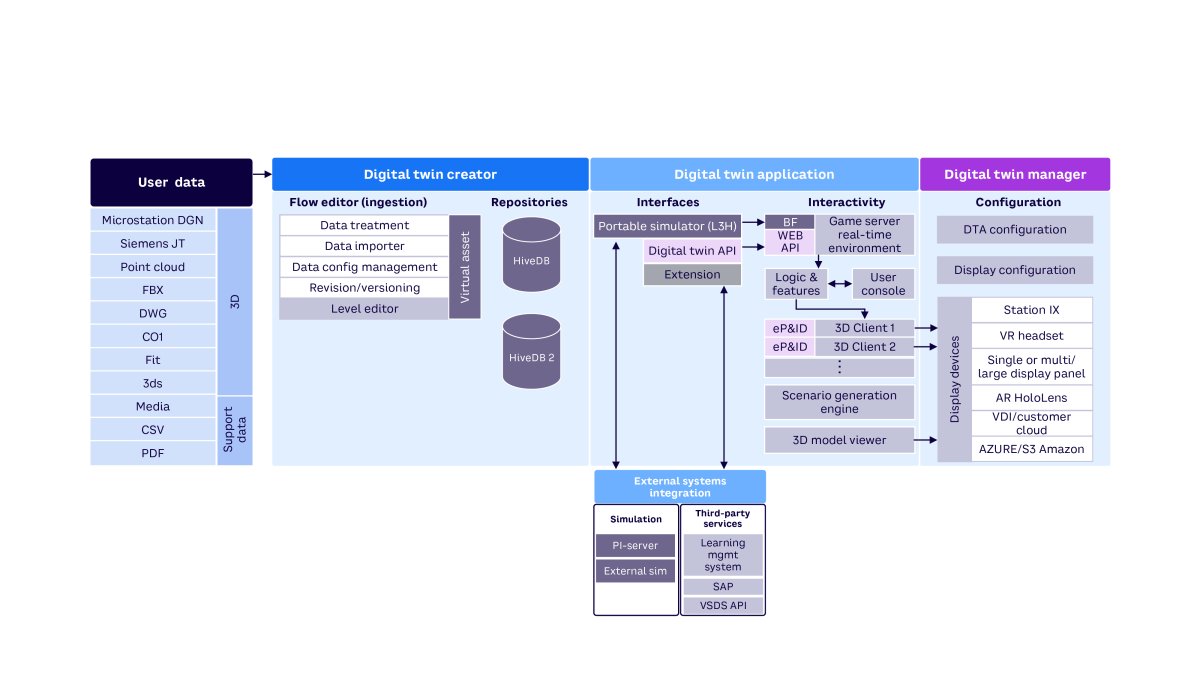
A nuclear power plant wanted a digital twin to use for virtual training, a process that involved combining engineering drawings with scans of the plant; developing a storage method conducive to additions, changes, and variations; producing a visualization via immersive display systems; and creating a platform capable of rapidly crafting training scenarios. The digital twin framework consists of three parts: a digital twin creator to ingest and contain digital twin assets, a digital twin application where assets could be used to create new applications, and a digital twin manager to visualize solutions (see Figure 1).
The engineering drawings supplied by the power plant comprised more than 20,000 i.dgn files. Around 10,000 of the files were tagged with a variety of metadata. Within the files were nearly 10,000 pieces of equipment and more than 100,000 total valves and instruments, all of which needed to be tagged, searchable, and viewable within the digital twin.
Light detection and ranging (LiDAR) data of one of the reactor facilities and surrounding buildings was obtained using Leica RTC360 laser scanners. These instruments take LiDAR data and, immediately after measurement, collect a series of high dynamic-range photographs the scanner uses to create a 360-degree panoramic photo. These are referred to as “sphere maps” because they are overlayed onto the interior of spheres in the 3D space for viewing. The individual point clouds, inherently colorless due to the measurement process, can be colorized by mapping photograph pixels to point cloud positions.
More than 11,000 of these scans/photographs were captured at the full resolution capability of the scanners, resulting in more than 11,000 colorized point clouds, each approximately 4 gigabytes. The point cloud scans were organized by building, by building level, and (in some cases) by quadrants on the building level. Using Leica Cyclone software, these smaller point cloud groups were combined into a single point cloud using a process known as “point cloud registration.” After that, the point cloud was down-sampled by removing points closer than 2 mm from one another (as opposed to down-sampling by measurement angle) so that objects far from the scanners retained full resolution while the resolution of objects close to the scanner was reduced (to shrink overall data size).
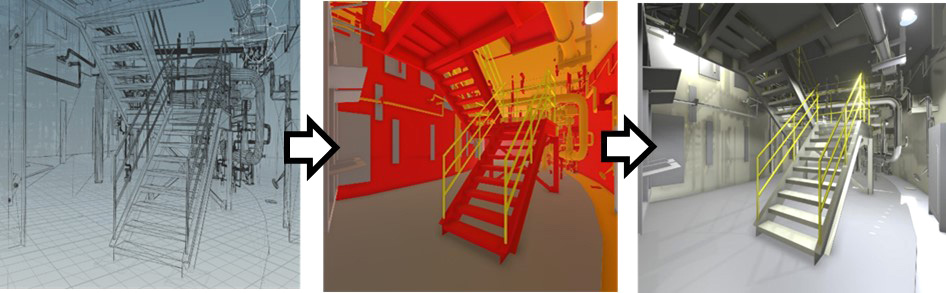
The next step was converting all the data into a common format in the digital twin framework. A tool was created to convert a variety of data types into a common format conducive to graphical rendering. The conversion was done using a series of sequential steps, visualized in the user interface (UI) as colored node blocks wired together. These node networks can be saved for later reuse or used as starting points for other, similar data in the future. The process of converting different data types into that framework data format is called “data ingestion.”
The ingested data was stored with 3D models, material, and other metadata. The data could then be viewed in a 3D viewer, with textures and lighting properties automatically applied to all like materials (see Figure 2).
After the computer-aided design (CAD) and LiDAR data was ingested, it was aligned and oriented in a common coordinate system, including a common origin, scale, and orientation. Each individual point in a point cloud has an accuracy of roughly +/-2 mm, so the process of combining two point clouds from two scans adds inaccuracy to the resulting data. Although the inaccuracy is small, it accumulates as more point clouds are registered together. For example, the width of a building level measured using 100 or more point cloud scans could be off by as much as a half meter. When viewing the point cloud overlaid onto the CAD model, this offset created an inaccurate association between CAD and point cloud, which was significant when switching between CAD and LiDAR data views.
To fix the inaccuracies between the CAD data and point cloud, the point cloud was “stitched” onto the CAD using foundational components, such as walls, floors, and doorways. The result was a dramatic improvement in accuracy between the CAD model and the point cloud data. The process also effectively located and oriented the panoramic photographs taken from the 3D scanner with respect to the CAD data.
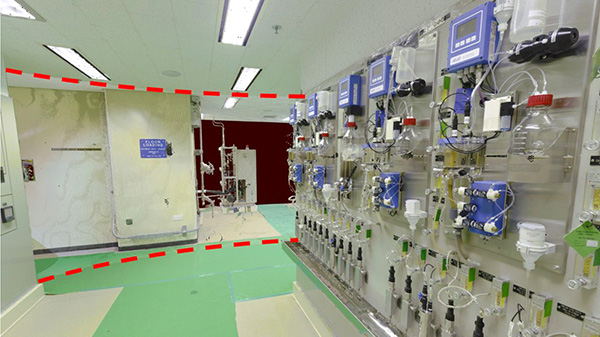
This resulted in a CAD model, point cloud data, and sphere maps with a common coordinate system and scaling. This enabled smooth switching between various data views, including point cloud data, sphere maps, CAD data, or a mixture of these. Figure 3 shows a hybrid view of a sphere map and point cloud data. Distances close to the viewer show sphere map photographs; distances farther from the viewer show point cloud data.
To make the digital twin functional, the digital twin designers worked with a partner to connect the 3D model to simulation software, allowing the digital twin to change based on the data from the simulation.
[For more from the author on this topic, see: “Exploring Digital Twin Potential for Energy & Defense.”]