
DECEMBER 1, 2015 — ARLINGTON, MASSACHUSETTS
According to Cutter Senior Consultant David Frankel, though we're excited by many new technologies, we still struggle with integration costs that can "consume so much of our computing budgets and resources that we have little left over for taking advantage of new opportunities and proactively managing change."
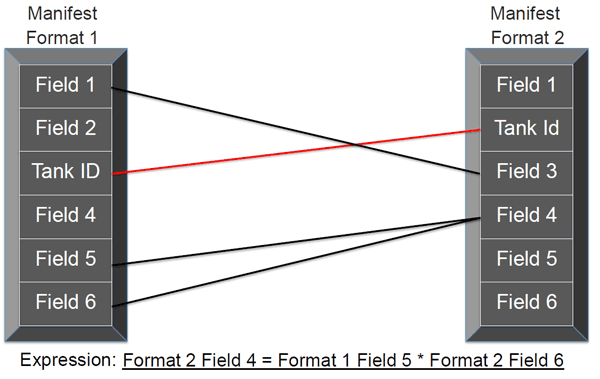
"Current state-of-the-art data mapping tools display two data structures on the screen and allow the analyst to graphically draw connections and write expressions to specify how the data elements of one structure map to elements of the other structure according to what rules (see Figure 1, where "Manifest Format 1" and "Manifest Format 2" are two different data structures). These tools take the graphical map and expressions as input and produce an executable transformation, in keeping with a model-driven approach -- a genuine advance over having to write transformation programs in lower-level code as per the predominant practice of 10-15 years ago."
But, Frankel explains, "Once the analyst has decided what should map to what, current-generation data integration tools simplify the mechanics of describing the mapping and getting it into executable form, and that is really a big help. It is not sufficient, however, because it can take the analyst a long time to determine the mapping and, if the analyst makes the wrong decision, the tools will simply make it possible to execute the wrong decision quickly."
In conclusion, Frankel finds that "This is the essence of the data integration problem that remains today. CIOs generally estimate integration costs at 30%-60% of their IT budgets, and data integration takes the lion's share of that."
* Excerpted from "Data Integration: The Perennial Challenge Part I," (![]() ) Business & Enterprise Architecture Executive Update Vol. 17, No. 11
) Business & Enterprise Architecture Executive Update Vol. 17, No. 11