What is technical debt? Consider the metaphor of running through mud. There are two consequences of running through mud. One of them is low speed, because the mud has high friction; therefore it slows you down. The second consequence is that mud is much less stable, making it much easier to injure yourself, such as twisting your ankle or falling. These consequences are metaphors for developing with systems that have high technical debt. Everything else about the systems is harder to do, slower, and more dangerous — there is a higher risk of failure in production, and the systems will be harder to maintain.
Even if we have a solid architecture, if it is implemented on poor-quality code we will still have problems. Making any changes or extensions to that architecture is hard because the code must be changed to do so. Our code is the foundation that we stand on; whether it is solid and stable or slippery and muddy depends on the level of technical debt.
How do we measure technical debt? Where does technical debt show up in our systems?
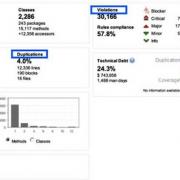
In Figure 1, the aspects highlighted in blue contribute to measures of technical debt. Code rule violations are indications of technical debt. Duplications in the code are copy-and-pasted blocks that exist in more than one place in the code base. The lack of comments or public API documentation is a risk because undocumented code can be misused accidentally. Code complexity — meaning McCabe cyclomatic complexity — is an indication that modules are either easy or hard to understand depending on how deeply nested the logic is. Code coverage, or rather lack of code coverage, means that we do not have a safety net of unit tests to tell us when onechange has caused non-local failures.
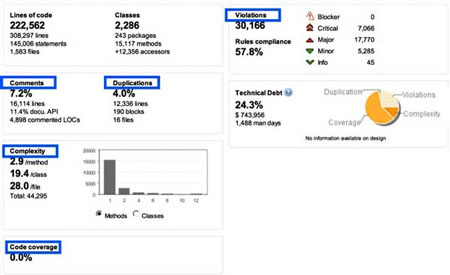
Figure 1 — Aspects of measurable technical debt.
Each of these things is a measurable aspect of the code, and against each one of these measurable aspects, we can assess an estimate of the time needed to fix it. For example, a code rule violation might take six minutes to fix, while duplicated blocks of code take two hours to fix. When estimates for all the aspects are applied, we can sum up the total effort require to remediate the total measured debt.
In this example, we have 1,488 days of total effort to remediate all of the measured technical debt in the system. Keep in mind that zero measurable technical debt is not the goal. That would be trying to achieve “perfect” code, which isn’t exactly the goal in a good, functioning business system. What we want is appropriately low levels of technical debt so that we do not tend toward bad customer responsiveness or risks to future maintainability.
High complexity is an indication of error-prone modules. One analysis found that at cyclomatic complexity of 38 units per module (Java class), the risk of errors occurring was 50% (see Figure 2). That is a significantly high number. The lowest risk was at a complexity of 11, which is a very low cyclomatic complexity for a Java class, with a risk of error of 28%. The risk rises very rapidly with increasing complexity.
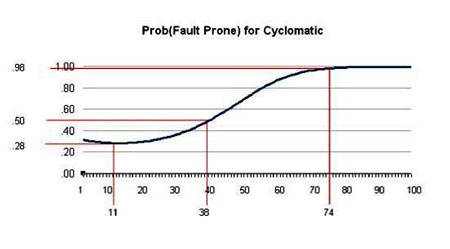
Figure 2 — Likelihood of error proneness given cyclomatic complexity. (Source: Terrill.)
So what is technical debt again? Technical debt is two things. First, technical debt is an indication of the total remediation cost. Again, we do not want to remediate all the way down to zero but to a responsibly low level, and then to stay at that responsible level — not to trend up. So it is an effort cost to fix measurable problems in the code base. Second, technical debt is an indication of future risks of failure. In this case, what we can see is that technical debt gives us a hint at how risky projects are to our future cost of change or reliability in production.
When customer responsiveness has started to fall off precipitously, as in Figure 3, we have only three strategies that we can apply:
- We can do nothing, and likely everything will continue to get worse. Our customer responsiveness will continue to go down.
- We can replace the system in a big rewrite. This is, of course, a high-cost and high-risk endeavor.
- We can invest in incrementally refactoring and cleaning up the system, paying down that technical debt.
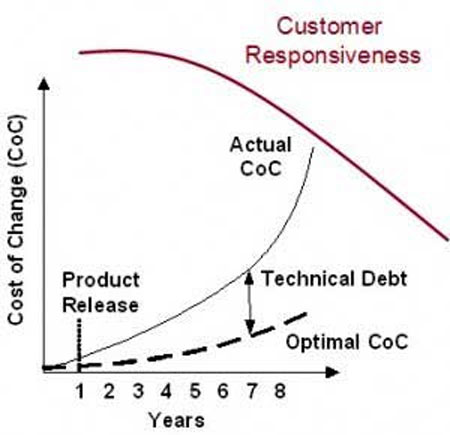
Figure 3 — Cost of change and customer responsiveness. (Source: Highsmith.)
None of these strategies is easy, and all have consequences. Once we have gotten to a significantly high cost of change and low customer responsiveness, however, they are the only options left to us.
[For more from the author on this topic, see "Using Technical Debt to Make Good Decisions."]