CUTTER IT JOURNAL VOL. 29, NO. 3

“Knowledge is power,” wrote Francis Bacon. Making decisions without important information can result in poor choices. That is especially true with respect to technical debt. Using a technical debt framework to inform our decision making is a powerful technique to help us quickly and confidently make better judgments. I’ve worked with numerous organizations that have benefited from understanding their technical debt this way, and in this article, I will share stories about three different clients and how they were able to make good decisions for their businesses based on the data we found during technical debt assessments.
MAKING GOOD DECISIONS IN YOUR PROJECTS
Making decisions is a part of every day, in every job. You’ve probably asked at least one of these questions today:
- Should we start project X?
- Should we cancel project Y?
- Should we reinvest in another project?
- Should we put some features on hold, or speed themup?
Only sometimes are these questions easy to answer, and often they create conflict and indecision. Today’s complex business landscape, combined with increasing expectations, creates growing pressure for decisions tobe made quickly and accurately. We can’t afford to make the wrong decision, and we can’t afford inaction.
While risk analysis is frequently used to help make decisions, an often-overlooked risk involves time. We need to get to market; we want to quickly respond to change. Responding to change, however, means that we must remain responsive over time. Building for only the short term can easily create unmaintainable systems. This poses a significant risk to our futures because the competition and technology landscape are constantly changing. The following questions can help uncover the effect that time has on our project:
- What is the risk that we will slow down?
- What are the consequences of slowing down?
- How can we prevent our slowing down?
In addition to factoring in time directly, we need to consider the cost of delay. We can calculate how much it costs us to not release features. Measuring and calculating this cost can affect many of our decisions.
THE COST OF CHANGE
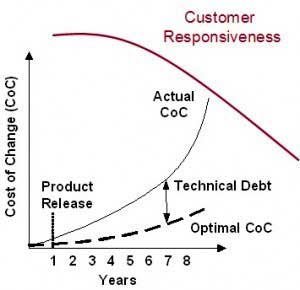
Figure 1 shows that increasing the cost of change leads to slowing down our customer responsiveness. One of the primary reasons that we slow down is because it gets harder and harder to change things. If the cost of change in our systems goes up, then at some point we become less responsive, and we slow down. Here, we are breaking the cost of change into two different components. One of them is the basic underlying cost of change, the natural or optimal cost of change for our systems. The second curve shows the additional cost of change due to technical debt. When our systems have high technical debt, it makes everything harder to do.
DEFINING TECHNICAL DEBT
What is technical debt? Consider the metaphor of running through mud. There are two consequences ofrunning through mud. One of them is low speed, because the mud has high friction; therefore it slows you down. The second consequence is that mud is much less stable, making it much easier to injure yourself, such as twisting your ankle or falling. These consequences are metaphors for developing with systems that have high technical debt. Everything else about the systems is harder to do, slower, and more dangerous — there is a higher risk of failure in production, and the systems will be harder to maintain.
Even if we have a solid architecture, if it is implemented on poor-quality code we will still have problems. Making any changes or extensions to that architecture is hard because the code must be changed to do so. Our code is the foundation that we stand on; whether it is solid and stable or slippery and muddy depends on the level of technical debt.
How do we measure technical debt? Where does technical debt show up in our systems?
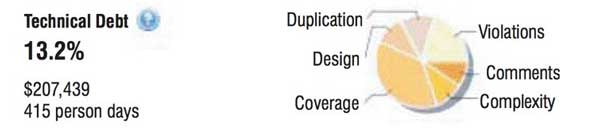
In Figure 2, the aspects highlighted in blue contribute to measures of technical debt. Code rule violations are indications of technical debt. Duplications in the code are copy-and-pasted blocks that exist in more than one place in the code base. The lack of comments or public API documentation is a risk because undocumented code can be misused accidentally. Code complexity — meaning McCabe cyclomatic complexity — is an indication that modules are either easy or hard to understand depending on how deeply nested the logic is. Code coverage, or rather lack of code coverage, means that we do not have a safety net of unit tests to tell us when onechange has caused non-local failures.
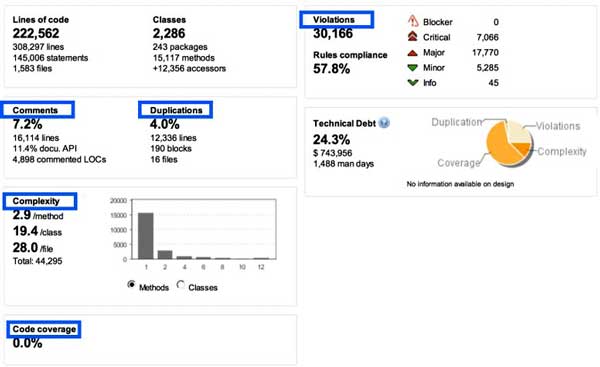
Each of these things is a measurable aspect of the code, and against each one of these measurable aspects, we can assess an estimate of the time needed to fix it. For example, a code rule violation might take six minutes to fix, while duplicated blocks of code take two hours to fix. When estimates for all the aspects are applied, we can sum up the total effort require to remediate the total measured debt.
In this example, we have 1,488 days of total effort to remediate all of the measured technical debt in the system. Keep in mind that zero measurable technical debt is not the goal. That would be trying to achieve “perfect” code, which isn’t exactly the goal in a good, functioning business system. What we want is appropriately low levels of technical debt so that we do not tend toward bad customer responsiveness or risks to future maintainability.
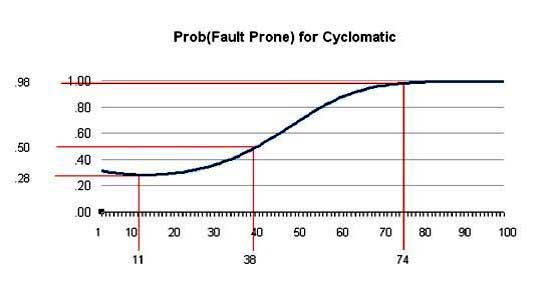
High complexity is an indication of error-prone modules. One analysis found that at cyclomatic complexity of 38 units per module (Java class), the risk of errors occurring was 50% (see Figure 3). That is a significantly high number. The lowest risk was at a complexity of 11, which is a very low cyclomatic complexity for a Java class, with a risk of error of 28%. The risk rises very rapidly with increasing complexity.
So what is technical debt again? Technical debt is two things. First, technical debt is an indication of the total remediation cost. Again, we do not want to remediate all the way down to zero but to a responsibly low level, and then to stay at that responsible level — not to trend up. So it is an effort cost to fix measurable problems in the code base. Second, technical debt is an indication of future risks of failure. In this case, what we can see is that technical debt gives us a hint at how risky projects are to our future cost of change or reliability in production.
When customer responsiveness has started to fall off precipitously, as in Figure 1, we have only three strategies that we can apply:
- We can do nothing, and likely everything will continue to get worse. Our customer responsiveness will continue to go down.
- We can replace the system in a big rewrite. This is, of course, a high-cost and high-risk endeavor.
- We can invest in incrementally refactoring and cleaning up the system, paying down that technical debt.
None of these strategies is easy, and all have consequences. Once we have gotten to a significantly high cost of change and low customer responsiveness, however, they are the only options left to us.
USING TECHNICAL DEBT TO MAKE GOOD DECISIONS: THREE STORIES
Story 1: The Online Broker That Refactored
My first story is of an online broker in Texas that refactored and cleaned up their code base.1 They had a 10-year-old Java-based system in production and were serving a large number of customers. When my colleagues and I engaged with them, they were experiencing reliability problems with the system and had themselves concluded that everything was hard to do. This was a high-friction environment that had become difficult to maintain.
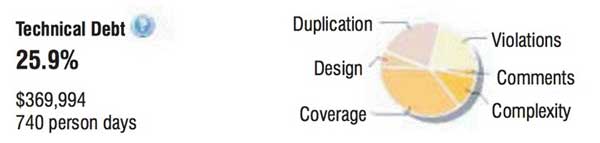
Figures 4 and 5 show the technical debt at the beginningof the project and at the end of the project. The key here is that at the beginning of the project, we measured 740 person-days of technical debt. After the refactoring effort, only 415 person-days of technical debt remained measurable in the system. We had made significant cleanup progress, mostly at the lower levels of the system.
Let’s look at this case in a little more detail. This was an online broker of precious metals such as gold and silver. Managing and tracking the financial exchanges was paramount; the cost of failure was exceptionally high.
We refactored the heart of the application, cleaning upand exposing the central business logic. We built a Hibernate object-relational mapping domain model as the core of the application, refactoring all of the business logic that had been strewn about the application into that core logic. We succeeded in creating a layered design and a clear dependency-managed system. This gave us a solid foundation in the application to then make better, safer decisions going forward.
Providing technical debt measures to the online broker allowed them to see why they were experiencing reliability problems with the system and why everything was so hard to do. Here are some of the key things that changed during this project. At the start of the project, there were over 90,000 lines of code in the production system. At the finish of the project, there were just over 70,000. We reduced the size of the system. We removed lines of code. We also removed significant complexity. The average complexity at the start of the project was 23 units of cyclomatic complexity per Java class. At the end of the project, that average went down to 15.
While there were still some classes that had significantly high complexity, we made substantial changes across many of the classes, including key central business classes that were simplified greatly. The duplicated blocks of code went down from 22% to 7.6%. Admittedly, 7.6% is still a high number for code duplications, but if we had measured only those code duplications in the central business domain layer, it would have been a much, much lower figure than that. The user interface and top layer of the application were not refactored significantly and still had quite a bit of duplication in them.
We also increased the unit test coverage from 0% to nearly 20%, which was a major increase in testing coverage. This gave the development team a modest but solid safety net with which to work.
Story 2: The Online Retailer That Rebuilt
We also worked with a San Francisco–based, international online retailer. They have a dozen teams spread throughout the US, Europe, and India. The user interface for their system was becoming very difficult to maintain, very buggy, and very slow to change. There was already an internal ground-up effort to replace it. Management, however, was skeptical of this effort and unsure whether it was actually needed.
We found two important factors for management to consider. First, our analysis of the code bases showed that the user interface layer was, by far, the most technical debt–saturated part of the system, measuring at least $11.28 per line of code of technical debt. This is outside of the common range that we usually see, which is usually $2-$10 per line of code. So this was significantly tech debt–ridden code.
Second, the Java server pages totaled 762,000 lines of code. The amount of duplication in this code base, in this user interface, was over 40%. This was a very high number, indicating that the ability to maintain this code had degraded considerably. After we showed management this information, they were able to conclude with confidence that the rewrite effort was justified. The organization was then able to move forward with a unified purpose and replace the user interface.
Story 3: The Tool Vendor That Increased Technical Debt
Making good decisions about technical debt would seem to preclude the notion that you might choose to increase technical debt. However, we worked with a tool vendor that chose to do just that. Why was increasing technical debt a good idea for this company?
The enterprise in question, a Germany-based international manufacturer, had adopted both Agile and technical debt measures. They had stringent targets for their technical debt, achieving some of the lowest levels of technical debt we have measured. After making significant progress on reducing technical debt in their systems, ahigh-value opportunity to win a customer presented itself, but the company was given an exceptionally short time frame in which to land the business. If they had chosen to continue with the same strategy of pushing technical debt down, they would have not been able to deliver in time to win this customer and their business.
The cleanup period shown on the left of Figure 6 is what they had been doing; namely, significantly reducing the technical debt in the system. When this new opportunity arose, they were presented with the option of passing on it or duplicating and copying an entire subsystem, thereby creating a massive amount of duplication in their systems and increasing their technical debt significantly. This increase in technical debt was inviolation of their stated policies.
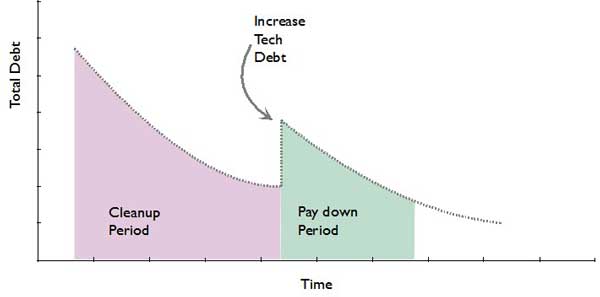
In the end, they made a very reasoned and mature decision to duplicate the subsystem, while remaining diligent about technical debt and following up afterward to pay back the debt they incurred. In the paydown period, they continued to invest in reducing that debt and removing the duplication over time by refactoring the systems. In this way, though they made a business decision to incur debt that had high payback, they had the maturity to continue remediating their debt.
CONCLUSION
If time is money, we need to consider the risk of going slow in the future. We can use cost of delay and customer responsiveness as two measures to quantify this risk. The takeaway, though, is that while going fast today is critically important, we also need to build the capability to go even faster tomorrow. If our systems are going to slow down, and we do not work to prevent that from happening, then we’re setting ourselves up for low customer responsiveness problems in the future.
Technical debt measures two things: (1) the total remediation cost to clean up the measurable code-level technical debt aspects of the system, and (2) the risk of future failures. It is an indication of that risk.
What’s next? Here are a number of things to do with your team:
- Identify the products at risk of going slow.
- Consider using the cost of delay to assess that risk.
- Assess technical debt measures for each at-risk project.
Use technical debt measures as a leading indicator todevelop a remediation plan to prevent future problems with customer responsiveness.
1 To read more about this project, see: Heintz, John. “Modernizing the Delorean System: Comparing Actual and Predicted Results of a Technical Debt Reduction Project.” Cutter IT Journal, Vol. 23, No. 10, 2010.