
CUTTER BUSINESS TECHNOLOGY JOURNAL VOL. 30, NO. 4

What Is a Robo-Advisor?
Robo-advisors are a class of financial advisors that provide financial advice or portfolio management online by employing algorithms such as modern portfolio theory (MPT) to conduct portfolio management. Not that automated, online investing platforms are a new thing. In 1996, Nobel Prize winner William F. Sharpe co-founded Financial Engines, one of the first algorithmically driven investment platforms. Now, however, robo-advisory (digital investment) platforms are becoming more visible. Wealthfront, Betterment, and traditional corporations such as Charles Schwab, Vanguard, and Fidelity have also launched their own robo-advisors. In fact, more than 50 firms can loosely be included in the robo-advisor space.
In 2015, robo-advisors managed US $55-$60 billion in assets and Schwab Intelligent Portfolios, Wealthfront, and Betterment make up more than 50% of this robo-advisory services market. In the first quarter of 2016, Financial Engines had surpassed $975 billion in assets under contract and $122 billion in assets under management for over 9.6 million people. According to a survey conducted by A.T. Kearney, robo-advisors will run $2 trillion assets under management by 2020.
In general, robo-advisors are classified into three types:
-
Pure technology websites that are devoid of human advisors
-
Companies that employ advisors to use technology only to communicate with clients
-
Traditional financial services companies that have recently expanded their online advice offering
Robo-advisors differ from each other in provided services, fees, and (especially) algorithms, including asset classification, exchange-traded fund (ETF) selection, portfolio optimization, and rebalancing.
Investment Methodology
The investment methodology of most robo-advisors begins with asset allocation, proceeds to implementation, followed by monitoring and rebalancing. The flowchart in Figure 1 illustrates the stages involved in a robo-advisor system.
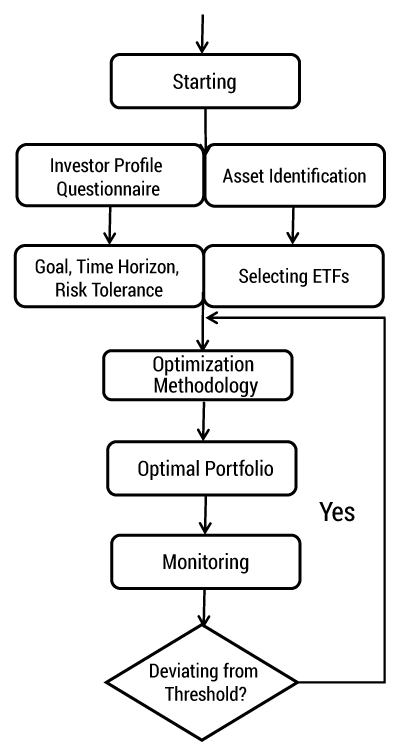
Figure 1 — The asset allocation process in robo-advisors.
Below, we choose the most notable robo-advisors in the US — namely, Betterment, Wealthfront, and Schwab Intelligent Portfolios — to make detailed comparisons. Although they are quite similar, they have their own features. Betterment uses smart financial models, such as a downside-risk optimization model, to make sure that each of its four primary investing goals (retirement, safety net, general investing, and major purchase) is based on a different stock allocation path. Wealthfront is more like a technology company, making sophisticated financial advice and investment strategies available to every individual investor at low cost by combining financial theory and machine learning. Schwab, as a traditional financial services firm, uses more traditional investment strategies in asset allocation.
Asset Class Identification
Given the different features of asset classes, robo-advisor companies often divide them into three broad categories: stocks, bonds, and inflation assets. Stocks have high expected returns in the long run but high volatilities, while bonds have low expected returns but low volatilities, as well as low correlation with stocks. We also need assets that are highly correlated with inflation, such as US Treasury Inflation-Protected Securities (TIPS), real estate, and natural resources.
Because of increasing external shocks, lower returns, and higher correlations between traditional assets, Schwab’s asset allocation also encompasses nontraditional asset classes, like gold or other commodities. All the asset classes in Schwab Intelligent Portfolios must be accessible through at least two liquid ETFs and be minimally correlated to achieve greater diversification benefits. Asset classes in Schwab are divided by their role in the portfolio. According to Schwab:
-
Growth potential will come primarily from the equity allocations.
-
Growth potential and income will come from dividend-paying stocks.
-
Income will come from a broad array of fixed-income investments.
-
Inflation protection comes from allocations to US inflation-protected bonds, FDIC-insured cash, and Real Estate Investment Trusts (REITs).
-
Defensive assets are generally assets that have low or negative correlations with equity securities.
When building the portfolio, Schwab combines market-cap strategies and fundamental strategy by dividing stocks into market-cap stock and fundamental stock. For example, we can divide US large company stocks into US large company stocks and US large company fundamental stocks. For its part, Betterment classifies assets into stocks and bonds in its portfolios, while Wealthfront’s portfolios include real estate and natural resources besides stocks and bonds.
In general, the main goal of asset classification is to construct a diversified portfolio; thus, the main methodology behind this classification is to estimate the correlation between the asset classes. From Table 1, we can see that Schwab has the largest number of asset classes and is also the only robo-advisor invested in master limited partnerships. However, there is always a tradeoff between diversification and expected return. By including some lower-risk assets (e.g., bonds) in the portfolio, you may be losing out on the potentially higher return of assets such as stocks. And with too many asset classes, using the mean-variance model to estimate the optimal portfolio often brings many problems due to the maximum and minimum constraints, as we will discuss below.
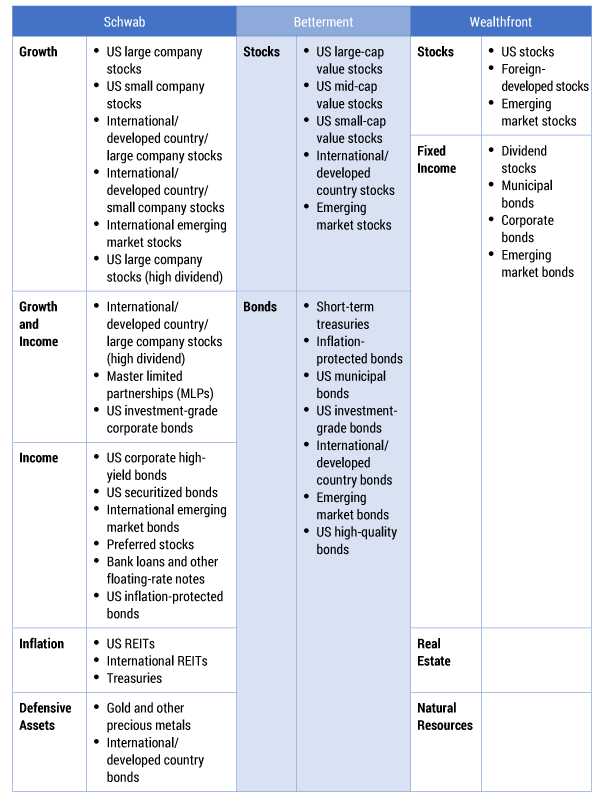
Table 1 — Robo-advisors: asset classification
Selecting ETFs
Mutual funds can make no claim to be superior over the market averages. Most robo-advisor companies exclusively use open-ended index tracking ETFs rather than mutual or closed-end funds due to their low manager risk, low embedded costs, and natural tax efficiencies. They select ETFs based on two main features: cost and liquidity. The cost of ETFs consists of fund expenses imposed by the ETF administrator, bid-ask spread in market interaction, and performance deviations from the benchmark index, or tracking error. Sufficient liquidity is needed to make sure the selected ETFs can be withdrawn at any time.
When assessing whether an ETF accurately reflects one asset class, Schwab considers geographic exposure, market cap, industry/sector concentration, yield, duration, and tracking error. At the present time, exchange-traded notes (ETNs) and limited partnership ETFs are ineligible for Schwab Intelligent Portfolios. Once ETFs are selected for Schwab Intelligent Portfolios, they are monitored on a periodic basis to ensure that they remain an appropriate choice for the portfolios.
Betterment’s approach is to aggregate expense ratio, bid-ask spread, and tracking error into a single variable called total annual cost of ownership:
![]()
Here, E denotes expense ratio, imposed by the ETF administrator, S denotes bid-ask spread, and T denotes the tracking error. Once this variable has been calculated, Betterment then selects the ETFs with the least cost.
Wealthfront employs the same methodology, selecting passive index ETFs that either minimize lending or share the lending revenue with their investors to reduce management fees.
Investor Profile
In order to match each client’s investment goals and determine the optimal mix of the portfolio, robo-advisor companies often ask clients risk questions and verify the consistency among the answers. A typical survey consists of dozens of questions to identify an individuals’ risk tolerance, while some companies, such as Wealthfront and Schwab, have simplified this process (see Appendix).
Investment Goal and Portfolio Sets
In Schwab’s questionnaire, investors can choose from among these goals:
-
Prepare for retirement
-
Save for major upcoming expenses (education, healthcare bills, etc.)
-
Save for something special (vacation, new car, etc.)
-
Build a rainy day fund for emergencies
-
Generate income for expenses
-
Build long-term wealth
These six goals have different portfolio sets. In general, the portfolio sets of goals 1, 3, and 6 all include stocks, fixed income, cash, and commodities, while only stocks, fixed income, and cash are included in the portfolio sets of goals 2, 4, and 5.
Betterment is a goal-based investing company that claims to customize the time horizon and purpose for every investment account to optimize investors’ savings and ensure that investors meet their goals. To manage risk for individual goals, Betterment has developed four primary types of investing goals: retirement, safety net, general investing, and major purchase. Each of these goal types is based on a different stock allocation glide path, which provides an allocation plan based on the investor’s personal time horizon for each goal. Betterment divides its asset classes only into stocks and fixed income (six stocks and six bonds). So for each of the goal types, Betterment provides a recommended minimum and maximum stock allocation, anticipated term, and certain cash-out assumptions. Table 2 shows the detailed goals, which we will discuss further below.
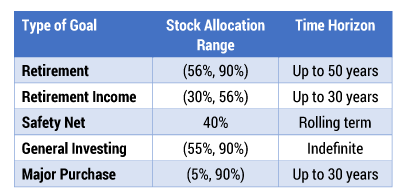
Table 2 — Betterment portfolio sets according to investment goal.
Wealthfront just divides the investor’s goals into general savings, retirement, and other. Since Wealthfront enforces minimum and maximum allocation constraints for each asset class, the portfolio sets have almost the same asset classes, while the weight of each asset class in the specific portfolio set differs. That said, taxable accounts always include municipal bonds, while retirement accounts replace municipal bonds with corporate bonds and emerging market bonds.
Risk Spectrum
Educational psychologist Michael Roszkowski and his coauthors found that combining risk-attitude (or behavior-related) questions with objective questions will provide a more complete understanding of the investor. Schwab thinks the investor’s risk capacity is based on information about their financial situation, while their willingness to accept risk is typically indicated by the level of volatility they’re comfortable with and other factors. And an investor’s risk capacity and risk willingness are generally independent of each other:
Risk Tolerance = Willingness to Take Risk + Capacity to Bear Risk
To assess an investor’s attitudes toward risk, Schwab’s Intelligent Portfolios IPQ (Investor Profile Questionnaire) contains 15 questions:
-
Five questions capture factual information to assess an investor’s risk capacity.
-
Six questions collect information about the investor’s behavioral attitude toward risk to calculate their risk willingness score.
-
Four questions ask about the investor’s age and product preferences, such as Total Return/Income or Muni/Taxable bonds.... [to] help determine the appropriate set of portfolios.
Betterment doesn’t measure investors’ risk tolerance directly. Instead, it tries to do asset liability management, which is a framework for ensuring that the investor’s future expenditures are funded (if not overfunded) whenever they appear. Betterment only asks its investors four questions to understand their goal and time horizon. It then uses a downside risk model to build recommendations.
In order to identify the ideal asset allocation for an investor’s needs, Wealthfront tries to pinpoint an investor’s risk tolerance with eight questions. It also tries to calculate the objective capacity to take risk and subjective willingness to take risk independently, just as Schwab does. However, unlike Schwab’s methodology of assigning equal weight to “Risk Willingness” and “Risk Capacity,” Wealthfront assigns a heavier weight to whichever component is more risk-averse, because behavioral economics research shows that individuals consistently overstate their true risk tolerance — especially male investors who are educated and overconfident. Clients are also allowed to adjust their assigned risk score once every 30 days.
Asset Allocation Models
Among the complicated asset allocation models used by robo-advisor companies, the mean-variance model and Black-Litterman model are the most common. Mean-variance optimization, first introduced by economist Harry Markowitz in 1952, tries to maximize the expected return for a given level of portfolio risk. And the Black-Litterman model, developed by economists Fischer Black and Robert Litterman at Goldman Sachs in 1990, combines managers’ views about asset class returns with the market equilibrium implied returns, which are the set of returns that clear the market. We can derive the equilibrium returns from the formula below:
Π = δ Σ ωmkt
where:
-
Π is the vector of implied equilibrium excess returns for each asset.
-
δ is the risk aversion coefficient.
-
ωmkt is the market capitalization weight.
-
Σ is the covariance matrix of the excess returns for the assets. A presumed efficient benchmark is included in the calculation.
As for these three robo-advisors, Schwab combines mean-variance optimization and full-scale optimization together to model the investor’s preference as to loss aversion. The two techniques Betterment uses are the Black-Litterman model and the downside risk optimization model. In addition to the mean-variance optimization model, Wealthfront uses such techniques as the capital asset pricing model (CAPM) and the Gordon Growth model.
Mean-Variance (MV) Model
There are four major assumptions for Markowitz’s MPT:
-
There are n risky assets in the market, with known distribution of their rate of returns, and a non-singular covariance matrix.
-
There are no frictions in the market. That is to say, we ignore any kinds of transaction costs, assume no bid-ask spreads, allow short-selling, and so on.
-
Individuals in the market make their decisions according to the mean and variance of financial assets. Specifically, they are risk-averse in that they prefer a portfolio with lower variance for a given level of risk, or they want to minimize risk for a given level of returns.
-
All individuals have the same time horizon for investment. So our analysis is based on a one-period, discrete time situation.
For each asset i, we denote its rate of return a random variable ri, and define the random vector r = (r1, r2, ...,rn)T. Let e = E(r) and Σ = Cov(r) be its mean and covariance.
Then, we define vector ω = (ω1, ω2, ..., ωn)T as the set of weights associated with a portfolio.
From our assumptions, we can formulate the optimal portfolio selection problem as follows:
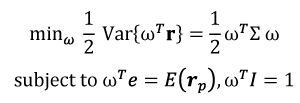
where Ι = 1, 1, ..., 1)T is the vector of ones.
We can solve the optimization problem via the method of Lagrange multipliers. Firstly, the formulas can be rewritten as below using Lagrange multipliers:
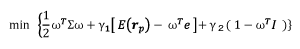
where γ1 and γ2 are the multipliers.
Then we can compute the three first-order conditions (FOCs) for a critical point as to ω, γ1, and γ2. Last, the optimal weight can be obtained with the three FOC equations. MIT finance professor Robert C. Merton has provided detailed steps of the analytical solutions.
While the mean-variance model is a classic framework for asset allocation, Black and Litterman have pointed out that the use of it by investment managers has been limited by two recognized problems. First, it’s not easy to estimate the expected returns of all assets and currencies for investors, with the result that their views are augmented. Second, the weights are extremely sensitive to the return assumptions used. For example, the optimization portfolio always ordains large short positions when investors impose no constraints. And the optimization portfolio often prescribes “corner” solutions with zero weights in many assets when short positions are ruled out.
Capital Asset Pricing Model (CAPM)
In the early to mid-1960s, the famous capital asset pricing model was introduced, independently, by investment theorist Jack Treynor, Stanford finance professor William F. Sharpe, Harvard Business School professor John Lintner, and Norwegian economist Jan Mossin to explore the relation between risk and returns of assets under market equilibrium. Compared to the mean-variance model, it has two additional assumptions:
-
There is a risk-free asset in the market with no bid-ask spread.
-
All investors have access to the same information and agree about the risk and expected return of all assets (homogeneous expectations assumption).
The risk of a portfolio comprises systematic risk and unsystematic risk. Unsystematic risk can be diversified away to zero while systematic risk is undiversifiable. The critical improvement of CAPM is that it studies the pricing of a portfolio from the market perspective. CAPM introduces the concept of a market portfolio to reflect the investment choice of the whole market. Then, it uses the corollary that the market portfolio is optimized on the efficient frontier. That is to say, the market portfolio contains only systematic risk, or the total risk of the market portfolio can be viewed as systematic risk (beta, β). Then the CAPM prices portfolios via the expected market excess return and the portfolio systematic risk (beta, β). We denote the return of the market portfolio as rm and risk-free rate as rf . Then we can have expected market excess return E(rm) – rf . For any portfolio with return rq, CAPM gives its pricing formula as follows:
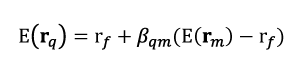
where:
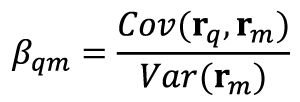
Therefore, if the market portfolio is observed (i.e., we know the mean and variance of the market portfolio), we can calculate a portfolio’s expected return by only examining the covariance between this portfolio and the market portfolio.
Although the CAPM offers powerful and intuitively pleasing predictions about how to measure risk and the relation between expected return and risk, University of Chicago finance professor Eugene F. Fama has argued that the empirical work shows that the relation between beta and average return is flatter than predicted by the CAPM.
To improve the model, relaxing the homogeneous expectations assumption might be a good idea. In fact, an investment manager gets a lot of views about returns of assets from their analysts. Therefore, it is natural to find a way to incorporate subjective views about the outlook for global assets with the market equilibrium implied returns to obtain an optimal allocation. We will discuss this in more detail in the following section.
Black-Litterman (BL) Model
Now, let μ, Σ , δ be the expected mean, covariance matrices, and risk aversion coefficient for a mean-variance optimization. For a standard, unconstrained, utility-based optimization, the optimal weights will be:
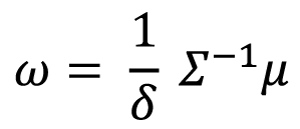
This implies that mean-variance optimization overweights (underweights) those assets that have large (small) estimated returns, negative (positive) correlations, and small (large) variances. Then we can measure the sensitivity of the weights to the expected return by deriving the formula:
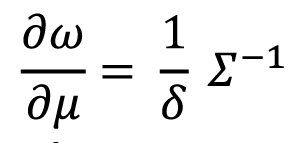
This implies that changes in μ tend to lead to large changes in portfolio weights. However, it is very likely to have large estimation errors when estimating the expected returns μ using historical sample data. As a result, those assets with positive pricing errors (estimated return higher than the true expected return) are significantly overweighted versus those with negative errors (estimated return lower than the true expected return). To overcome these problems in mean-variance optimization and incorporate investors’ views into this framework, Black and Litterman developed the Black-Litterman model in 1992. The BL model provides not only the equilibrium market portfolio as a starting point for estimation of asset returns, but also a clear way to specify investors’ views on returns and to blend the investors’ views with prior information. This is made explicit in Figure 2.
![Black-Litterman model: deriving new expected combined return vector, E[R].](/sites/default/files/itjournal/2017/cbtj1704-03-fig02.jpg)
Figure 2 — Black-Litterman model: deriving new expected combined return vector, E[R].
Using Bayes’ theorem, we can derive the new expected combined return vector as follows:
![]()
where:
-
E[R] is the new combined return vector.
-
τ is the weight-on-views scalar.
-
Σ is the covariance matrix.
-
Ρ is the matrix that identifies the asset involved in the different views.
-
Ω is a matrix that identifies the uncertainty in the views.
-
Π is the implied equilibrium return vector.
-
Q is the estimated return vector for every different view.
After we obtain the new combined return vector, we can substitute it into the mean-variance model to obtain the final optimal weights on each asset class.
Downside Risk Minimization (DRM)
Downside risk is the risk of the actual return being below the expected return, or the uncertainty about the magnitude of that difference. Value-at-risk (VaR) measures the potential loss in value of a risky asset or a portfolio over a defined period for a given confidence interval. VaR is defined as the (1 – β)-quantile of the distribution function F of losses of the portfolio; that is:
![]()
where:
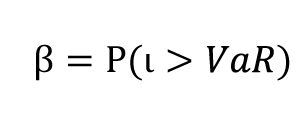
is called the shortfall probability. In other words, there is only a probability of β that losses can exceed VaR1–β.
Betterment mainly uses Black-Litterman to build personalized portfolios for investors. But with different time horizons, investors have different risk tolerance. To balance risk and time, Betterment first predicts the possible return distributions for one portfolio at a given level of risk (i.e., a 70% stocks portfolio) under different market scenarios (from top 5% to bottom 5% of potential outcomes) over 0-20 years. Then Betterment simulates returns for its portfolios at different risk levels (from 0% to 100% stocks) and compares the performances at a similar percentile (market scenario) over a fixed time horizon. Under different percentiles, Betterment can have the best stock allocation curve over different time horizons; thus, Betterment can have the best stock allocation under all percentiles. Finally, Betterment calculates the average “best” stock allocation across all percentiles to arrive at its goal-specific glide path.
Full-Scale Optimization (FSO)
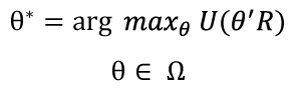
The normal distribution has a skewness (the third standardized moment) of zero and a kurtosis (fourth standardized moment) of three. However, asset returns probability distributions in general are not normal distribution, but feature both skewness and excess kurtosis. Negative (positive) skew indicates that the tail on the left (right) side of the probability density function is longer or fatter than the right (left) side. The excess kurtosis (kurtosis minus 3) greater than zero is platykurtic. Researchers usually explain investors’ preferences of these higher moments (i.e., skewness and kurtosis) with a complex utility function. Full-scale optimization is based on the entire empirical return distribution. In the single period portfolio model:
-
RnxT is the expected returns matrix of n assets in T different scenarios.
-
θnx1 is the weights vector for each asset in the portfolio.
-
U is the utility function.
-
Ω is the constraint matrix.
In the mean-variance approach, the utility function is quadratic, resulting in the mean and variance framework. In full-scale optimization, the bilinear function and S-shaped function are the most widely used (see Table 3).
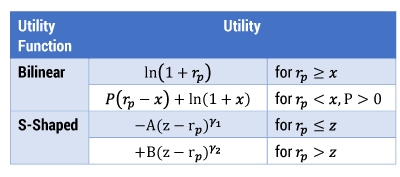
Table 3 — Functions used in full-scale optimization.
In Table 3, rp represents portfolio return. In the bilinear utility function, x is the critical return level called the “kink.” R is the penalty level for returns lower than the kink. And in the S-shaped function, z is the critical level. A, B, γ1, and γ2 determine the curvature.
In Figure 3, the parameters are, x = z = 0, R = 5, A = 1, B = 2, γ1 = 0.3, γ2 = 0.7. As is shown in the graphs, the zero-return is an inflection point for the utility functions. The two utility functions imply risk aversion, and the downside risk is always penalized. The investor’s preference of loss aversion is incorporated in full-scale optimization.
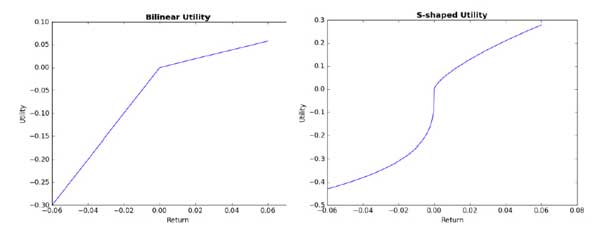
Figure 3 — Utility function.
Schwab Intelligent Portfolios uses full-scale optimization in its asset allocation. From the given resources, the bilinear utility function is most likely to be used in Schwab Intelligent Portfolios. And in the optimization, the return threshold is also set to 0; the slope below the threshold is set to two, which means that the pain of losses is two times more painful than the joy an investor would experience from a similar-sized gain.
Monitoring and Rebalancing
Yale University’s chief investment officer, David F. Swensen, found that rebalanced portfolios earned an average of 0.4% more per year, with less risk, over 10 years, than portfolios that were not rebalanced. Economist Burton Malkiel reported similar results over a different 10-year period. Robo-advisor companies generally employ threshold-based rebalancing, instead of time-based rebalancing, to take advantage of market movements.
To monitor portfolios, Schwab Intelligent Portfolios uses the Goal Tracker to help investors set up and track their investment goals. The Goal Tracker uses long-term expected return estimates and Monte Carlo simulations to show investors a better, average, and worse outcome, thus monitoring whether their portfolios are “on target” and making necessary adjustments to reach their goals. To create these long-term return estimates, Charles Schwab Investment Advisory (CSIA) uses a set of factors including interest rates, earnings, dividends, and others to estimate future returns and risk on a wide range of asset classes. A Monte Carlo simulation uses repeated sampling to determine the properties of some phenomenon (or behavior). To create the simulations, Goal Tracker uses long-term return estimation to estimate the performance of investors’ portfolios.
Schwab Intelligent Portfolios combines rebalancing and tax-loss harvesting as part of a unified process to coordinate the impact of trades. Here we just look at its rebalancing algorithm. On a daily basis, the algorithm checks to determine if asset class weights remain within a drift tolerance. If an asset class has drifted above its target allocation by a sufficient amount, the asset class is sold to bring it back to its target allocation. The cash received from the sale is allocated to the asset classes that are underweight. If an asset class has drifted below its target allocation by a sufficient amount, additional shares of the asset class are bought to bring it up to its target allocation. To make this purchase, overweight asset classes are sold down until there is enough cash to make the purchase. Beyond this, Betterment and Wealthfront also use cash inflows to buy underweighted asset classes.
Overall Comparison
Among the online financial advisory firms that leverage automation and algorithms to help manage client portfolios, Betterment, Wealthfront, and Schwab Intelligent Portfolios stand out for their low account minimums, easy-to-use interfaces, and innovative features. Table 4 gives a summary of the main features of the three robo-advisor companies.
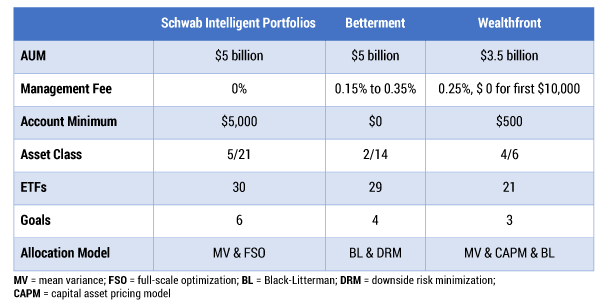
Table 4 — Robo-advisors: overall comparison.
Outlook
Compared to traditional financial services, robo-advisors not only provide automated, algorithm-based portfolio management advice, but also charge much less and have much lower minimum requirements for investors. As a result, A.T. Kearney predicts the compound annual growth rate of the robo-advisor market will reach 68% in the next five years.
In China, robo-advisors are still in an emerging phase since their introduction in 2014. Most of the existing products were launched in 2015, and they are much smaller than those abroad. These products can be divided into three categories, according to the companies that they are subject to:
-
Traditional financial company (e.g., Ping An, HarvestFund)
-
Independent third party (e.g., MiCai, Clipper Advisor)
-
Internet company (e.g., JD Finance, Snow, RoyalFlush)
When allocating asset classes, the mean-variance model, CAPM, BL model, and some other newly devolved models are popular among these robo-advisors in China. This is just like what their foreign peers are doing, but investors never know the details. For example, the way subjective views are generated is really a puzzle when a robo-advisor uses the BL model. This problem, of course, also exists in robo-advisors in the US. At the same time, robo-advisors in China mainly invest in A-shares, public funds, and Internet financial products, which goes against the basic passive index investing methodology of robo-advisors abroad.
Based on the passive index investing methodology, we think the future development of robo-advisors both in China and abroad lies in improving the mechanism for generating and rebalancing subjective views. Radford University finance professor Steven L. Beach and US Securities and Exchange Commission (SEC) economist Alexei G. Orlov have applied EGARCH-M models to generate views and have obtained satisfying results because these financial time series models capture many regularities of stock returns in an elegant and systematic way. Furthermore, machine learning techniques can be applied to forecast expected returns and volatilities. Machine learning models like support vector machines and neural networks have been adopted in volatility prediction by many recent research efforts. These techniques can be incorporated with the BL framework to improve performance. For rebalancing portfolios, an optimal strategy needs to combine threshold-based rebalancing and cash-in, flow-based rebalancing to reduce trading cost and improve performance.
Appendix: Investor Profile Questionnaires
Schwab Intelligent Portfolios Questionnaire
- My goal for this account is to:
- Prepare for retirement
- Save for major upcoming expenses (education, healthcare bills, etc.)
- Save for something special (vacation, new car, etc.)
- Build a rainy day fund for emergencies
- Generate income for expenses
- Build long-term wealth
- I have ___ understanding of stocks, bonds, and ETFs.
- No
- Some
- Good
- Extensive
- When I hear “risk” related to my finances:
- I worry I could be left with nothing.
- I understand that it’s an inherent part of the investing process.
- I see opportunity for great returns.
- I think of the thrill of investing.
- Have you ever lost 20% or more of your investments in one year?
- Yes
- No
- In the year I lost 20% of my investments/If I ever were to lose 20% or more of my investments in one year, I would:
- Sell everything
- Sell some
- Do nothing
- Reallocate my investments
- Buy more
- When it comes to making important financial decisions:
- I try to avoid making decisions.
- I reluctantly make decisions.
- I confidently make decisions and don’t look back.
- I am ___ years old.
- My initial investment for this goal is ___.
- One year from now, I’d be comfortable with my initial investment fluctuating between: (indicate range around initial investment size).
- I plan to save an additional ___ per month for this goal.
- I need the money for this goal starting in x years for y years. (Specify x and y.) OR I need income for x years (“Generate income for expenses” goal).
Betterment Questionnaire
- I am ___ years old.
- I am retired/not retired.
- My annual income is ________.
- What’s my plan? (retirement, safety net, general investing, major purchase)
Wealthfront Questionnaire
- What’s your primary reason for investing?
- General savings
- Retirement
- Other
- What are you looking for in a financial advisor? (Select all that apply.)
- I’d like to create a diversified investment portfolio.
- I’d like to save money on my taxes.
- I’d like someone to completely manage my investments, so that I don’t have to.
- I’d like to match or beat the performance of the markets.
- What is your current age?
- What is your annual pre-tax income?
- Which of the following best describes your household?
- Single income, no dependents
- Single income, at least one dependent
- Dual income, no dependents
- Dual income, at least one dependent
- Retired or financially independent
- What is the total value of your cash and liquid investments (e.g., savings, CDs, mutual funds, IRAs, 401[k]s, public stocks)?
- When deciding how to invest your money, which do you care about more?
- Maximizing gains
- Minimizing losses
- Both equally
- The global stock market is often volatile. If your entire investment portfolio lost 10% of its value in a month during a market decline, what would you do?
- Sell all of your investments
- Sell some
- Keep all
- Buy more