INTRODUCTION
Reflecting their student populations, universities have long been bastions of oodles of consumer technology. We are awash in mobile phones, laptops, tablets, gaming consoles, and the like. If one combines mobile consumer technology with Big Data analytics, one gets a host of new possibilities ranging from new ways of providing students with basic support to new ways of getting students to learn what the faculty needs them to learn. If we can get the right information flowing through the minds of students, perhaps we can improve their success. We can potentially help transform the classroom from the 19th century to the 21st.
The byproducts of all this data are the new insights that can drive decision making in new ways. When one adds into the mix advanced data visualization capabilities, one gets something different for university administrators and faculty: better and approachable insight into university operations and even the minds of the students. Higher education is at the cusp of gathering an unprecedented amount of information using affordable tools and techniques. The possibilities are numerous and succinctly expressed in the following statement:
In order to extract more value from data, you have to increase its surface area.
So said one of the contributors to this case study, Adam Recktenwald, very recently. The phrase "increase its surface area" is apt. Data now connects to decision makers and students in many ways. From phones, tablets, phablets, desktops (virtual and physical), navigation displays, cable TV, and, yes, even game consoles, all of us are exposed to more data now than ever before. But not all of it sticks in our heads. And for all sorts of reasons.
Data's thickness and the difficulty in bending it into shape has long been an impediment for organizations, requiring a class of people who have the knowledge and skill to bring data together from different sources, combine them, analyze them, and find patterns previously hidden. Many organizations, smitten by Edward Tufte's fabulous books on displaying information properly or chasing the elusive ease of any of Apple's splendid interfaces, have invested time and effort into the polish of great user interface and great data visualization.
But even after all that hard work, more often than one would like, accurate data beautifully displayed falls on deaf ears and blind eyes. Years ago, one of us working in industry pleaded with the C-level executives who ran the enterprise to stop and listen to the data. One C-level exec very politely and very abruptly said, "You don't understand. On the 22nd floor here, we live in a fact-free environment."
Hope springs eternal, even in the face of new challenges. For some years now, higher education has come under a microscope, blasted by some who criticize our costs and revered by many foreigners who wish to experience what to them looks like an intellectual, wide-open expanse that enthralls and excites. The increased attention has come along with difficult financial challenges. State and federal funding sources are reducing, in some cases dramatically. Institutions are now loathe to raise tuition prices both to avoid a public backlash and to watch out for competition in the higher education marketplace, ensuring that the institution remains competitive on price. This double pressure is now causing universities to look inward to find solutions, usually by reallocating funds away from less critical activities to more critical ones, by findings savings through automation, or to improve the recruiting and marketing of students to grow revenue. Today, all these roads lead to data and analytics.
EARLY ATTEMPTS AND AN AHA! MOMENT
Knowing the challenges and the opportunities, we began looking at ways of pulling together our core enterprise system (SAP) data, starting first with student data. Our thought was to develop a better means of providing this data so we could improve the productivity of IT resources that had been preparing data for analysis in a more ad hoc manner. In addition, we needed to build a data warehouse so that a broader group of analysts across the university data could access data for their own uses in a format that would be easier and simpler to use.
Unhappy with the high price of vendor data warehouse solutions and wary of their often excessive complexity and still unclear about SAP's emerging high-speed Big Data analytic strategy, we experimented with pulling incremental data from SAP's auditing subsystem. Our goal was to develop a means for creating a student data warehouse loaded incrementally on a near-real-time basis. We prototyped this poor man's real-time data warehouse within a few months early in 2011 and learned the following:
-
Incremental updates from an ERP system have surprisingly less volume and velocity than we thought. Analysis of the flow of changes suggested that an incremental technique that relies on knowledge of SAP's innards is feasible.
-
Transforming the incremental updates into a traditional data warehouse with fact and dimension tables was possible but was going to require more effort and resources than we were willing to allocate. And the approach was backward-looking, not forward-looking. We didn't want to build another traditional data warehouse.
-
The particular student data models we had in mind were minimalist. Expanding our scope was going to require additional effort linearly to the scope. In other words, we didn't see any returns to scale. We needed returns to scale.
In short, we found the approach technically viable, but didn't see it as enough of an architectural leap forward. Fortunately, in the middle of developing this Rube Goldberg data warehouse, we began to probe SAP further on its Big Data strategy. At first we were confused as SAP admittedly struggled early to properly describe its tool, HANA, to key decision makers, including why the product is different and how it relates to other SAP products. During 2011, however, we began to put the pieces together after direct discussions with SAP senior product team members and after reviewing Hasso Plattner's book on the topic (In-Memory Data Management, Springer, 2012). Within just a few key meetings with SAP product team leaders, it became obvious. HANA was a rewrite of a full-functioning, totally in-memory database environment. SAP had pulled together several database architectural features into one product including:
-
Parallel, in-memory relational query techniques. Moving query processing into an exclusively in-memory architecture means HANA could take radically different approaches for processing data that could exploit large data structures in memory for potentially radically different performance. Using high-speed parallel methods not unlike today's supercomputers meant that in time the product would have significant horizontal scalability potential, easily accommodating our data analysis volume.
-
Columnar stores. Databases that physically process and store data by column rather than row would perform far better on aggregate queries.
-
Compression technology. SAP makes great use of several different compression methods. Most typical databases and especially data warehouses have lots of repeating text and other repeating values. High compression rates means a smaller memory footprint, which means more data can fit in memory.
The combination of these features led us to conclude back then that this product was going to be a disruptive one, causing competitors to have heartburn, and that it would advance data warehousing significantly. We figured that while competitors will launch similar products, not all competitors can cannibalize their legacy products or are in a position to start fresh with a clean sheet of paper. Later we would learn our assumptions were correct. HANA is now a transaction database engine and is rapidly becoming an application development environment capable of processing relational and non-relational data in a distributed and potentially federated heterogeneous environment in which a single query could be processed via HANA and also via tools like Hadoop. Competitors are gearing up, and we are watching them carefully, but they are starting further behind. In short, we felt early on this product was going to be significant.
What Did We Learn?
-
Unless the IT team understands the disruptive technology's innards and can understand the technology market, the IT team will depend mostly on vendors in explaining the technology.
-
You will need careful profiling of your production environment to accurately predict performance and the impact of new technologies.
-
Where vendors tout performance, seek an order-of-magnitude difference for real disruption. In this case, the speedups where two to four orders of magnitude in performance (100x-10,000x).
THE BIG PAUSE
As part of building the business case for HANA, we noticed that when you tell someone that an incredibly fast Big Data appliance is now available, a long pause proceeds. We didn't immediately have a lot of ideas on how having a super-fast data analysis system might help. Pulling together our enterprise architects and best business intelligence (BI) folks, we stepped into a series of ideation meetings where we would collect our thoughts beforehand and then share and discuss. We only needed a few iterations and about 30 days to generate a pretty full list of ideas.
A simple guiding thought helped focus us: "If data analysis methods are incredibly fast, what could that do for university staff, faculty, and students? How can analytics infuse many processes?" Our discussion quickly focused on students and learning. After all, Google has spent the past 15 years perfecting analytics to get Web users to click on ads for stuff they don't need. Surely we can begin thinking about how to get students to interact with each other and with educational material that they really do need. Over the past few years, within the higher education software market, we had seen several solutions using more advanced analytics within them: Knewton, a vendor focused on analytically driven e-learning tools to help students master educational material through personalized learning technology, had achieved some publicity with its initiatives in various universities. Purdue University had developed a product that uses regression analysis methods to predict student success based on background characteristics (entering test scores, high school GPA, etc.) and use of the learning management system for classes (logins, breadth and depth of interaction, etc.), and licensed it to a top higher education software company.
Access Cutter’s Bottomless Resource of Reports and Case Studies — and Experts

Get guidance in leveraging emerging technologies and business management practices — via reports, case studies, and one-on-one conversations with Cutter Consortium's experts — that will enable digital transformation and boost your competitive advantage. Learn more about Cutter Consortium Membership.
But what we had in HANA that these software solutions did not have were two things: (1) easy and real-time integration with our core student information systems and potential integration with any other data source on students and (2) a super-fast computational environment at our disposal and under our control. We had a choice to make. We could procure multiple vendor software solution pieces knowing that we would have difficulty replicating data across different analytic systems and be further challenged with vendor limits on what we could potentially do with the data, or we could take a HANA-centric direction requiring us to invent some analytic and statistical techniques on our own but which would ultimately provide us with much more freedom.
Since our thoughts led us to analyze student behavior in both learning and non-learning situations, we felt it would be in the institution's long-term interest to maintain control over this data and, more importantly, the insights that future analysis might reveal. We reasoned that if analytics are competitive, the data and methods for analytics are proprietary and valuable. After all, does Google reveal the source code for its critical analytic methods?
After that one-month brainstorming period, our list of ideas included:
-
Give students real-time feedback on their involvement with the university (e.g., how they compare to peers in the frequency, breadth, and depth of usage in our learning management systems; how they participate in student events on campus; how engaged they are with advising and tutoring services). Research supports the simple notion that the more students are involved in their educational experience, the better they do. With mobile technology, students leave all sorts of potentially valuable digital footprint data.
-
Provide richer student retention and graduation analysis. Identify small segments of students for which the university can design targeted interactions or interventions. As part of this, generate prediction scores for student likelihood for graduation. Monitor these small segments in a real-time fashion and use workflow technology to notify advisors and staff when segments appear to have difficulty.
-
Integrate data from public social media and analyze for student involvement and success. Students are active in social media and connect with each other. Where appropriate and helpful, analyze their social media interactions and provide recommendations to improve their likelihood of retaining and graduating. A common problem for many students lies in their inability to socially connect on campus. Recommendations can include enhancing their social network on campus by recommending students to connect with/trigger interactions with advisors to help with any social integration issues and access to self-service information. With six-year graduation rates (a common industry benchmark) hovering around 59%, each 1% increase in graduation rates not only helps those students who graduate, but the university gains about a $1 million improvement in revenue while perceptions of the quality of the university improve.
-
Help students with learning. A fast data analysis tool like HANA can help with analyzing student interaction with various e-learning tools. For example, students use our learning management solution to access course documents; they use our lecture capture tools to re-listen to some classes when they return to their dorm rooms; and they use tools like clickers and Web and mobile tools to promote real-time interactions in the middle of a large lecture, not unlike many webinar solutions in use today. Since we have a wealth of data on the student, through HANA, we can analyze their interactions and push recommendations to the student in real time in the middle of their academic work. If we can detect students who are having difficulty with key concepts in courses across these different interaction platforms, we can help faculty deliver related content to the student in a highly automated fashion. In addition, many students simply need reminding. Providing an intelligent reminding service can help keep students on track in their classes.
-
Detect when students are failing to make sufficient progress. Navigating a college degree is not easy. Often degree programs have a complex list of prerequisites, dependencies between courses, and lists of many course options to choose from to fulfill a degree. Some students can wander off from the proscribed path in registering for courses. All systems today that try to calculate where a student is in his or her degree run in batch mode, which can take many seconds or minutes to complete. High-speed analytics can be brought to bear right in the middle of students registering and provide feedback to the student within milliseconds. When the system detects a student taking one or more classes that don't seem to advance toward his or her chosen degree and, more importantly, when the class doesn't seem to contribute toward progress for any degree (for undeclared students), workflow tools can alert the student and advisors quickly.
-
Give students intelligent course recommendations. Where students have options in selecting courses, an analytic approach can examine other students in the same degree program who are the most successful and build recommendations for good course options. This is akin to Amazon's recommendation engine, which lets customers know what other customers who have looked at the same or similar products have purchased.
-
Improve classroom scheduling and building utilization. Assigning classes to a room and assigning both instructors and students to the class can be an analytically difficult process, especially if the assignments are made with student success in mind. However, most if not all universities use a simpler, manual process of assigning classrooms to faculty and then copying assignments each year and modifying if needed. To secure the best possible room for a class, class schedules and faculty sometimes schedule in a way that does not effectively use the facility and, hence, enhance the delivery of classes to students. If a university with 50 buildings dedicated to teaching had a 10% increase in room utilization, for example, that could be the equivalent of five buildings worth of space. At the price of $50 million per building, this 10% increase in utilization can avoid a $250 million expense. Not all classrooms are equal. Chemistry labs need things that sociology classes don't. Fast analytic tools can help people pinpoint sources of bottlenecks within room utilization, thus saving construction and renovation costs.
-
Improve tuition revenue forecasting and the pinpointing of financial aid. In a Big Data environment like HANA, we can store data at the lowest level of detail right within the analytical model. We don't need to be afraid of processing 1 billion rows of data. We can use more detailed models to develop better forecasts regarding what financial benefits retention improvements may bring, where demand for degrees and courses are likely to shift, and how best to price tuition to maximize student success and university fiscal health. We can also use the combination of student success and involvement data to guide financial aid decisions. Universities typically have to award aid based on merit, or they face losing top students that enhance the university's attractiveness for other would-be students. Universities also have to award aid based on need so that they don't turn away capable but financially strapped students. Universities also must award aid for those who are most likely to benefit from the aid and graduate. These three goals -- merit, need, and success -- often cause tension. Advanced analytics can pinpoint where aid awards are most likely going to produce the best fit given these three goals.
Armed with these ideas for improving student success and university operations, we procured our Big Data tool, rapidly implemented the hardware, and then began what turned out to be a back-and-forth implementation process as teams began to learn how to use the new tool.
What Did We Learn?
-
New technology often catches people unaware and unprepared. Carve out the time for structured ideation before you get too far into the internal sales cycle.
-
With analytics, focus on the real customers and what information will help them make better choices. Then focus on the front-line employees that interact with the customers and how analytics can automate tasks and help them prioritize their efforts.
-
When vendors of disruptive general-purpose technology approach specific industries, they are as confused or often more confused than you as to how the technology can benefit the industry. Develop real-world use cases with concrete examples to demonstrate the benefits.
STICKY MENTAL MODELS
All of us tend to fight our next battle based on lessons learned from the last one. The problem with this is that people often look at the new problem with a mental framework indebted to the old problem and ill-matched to the new problem. Except for those truly visionary people, it takes time for us normal folks to realize that utilizing a new tool requires changing one's mind about the way the world works.
Take the term "Big Data" for example. While this term is trotted out constantly, it often occludes the real advantage in analyzing data: speed. In our case we felt that bringing data together in models that "increase data's surface area" -- that make the data more easily analyzed -- was critical. For many analysts, the speed of analysis matters greatly. In most environments, as staff analyze data, the analyst and the university community go through a highly iterative cycle that involves building a model, sharing it with key managers and leaders, reviewing data quality and assumptions, and repeating until the model is accepted. Most models built are one-off affairs and don't include all the detail needed to answer data interpretation and data quality questions. Business managers often wait days or weeks for responses to queries and development of new models. As this delay happens, new issues blow away old ones and analysis gets set aside. And the consumers of the information leave with the sense that IT just couldn't address their needs within a reasonable time frame. We believe the cause for this is due to inadequate deep thinking about novel architectures that can dramatically speed up this iterative data modeling cycle.
And we wanted to speed this cycle up dramatically. While HANA gave us between 300x and 1,500x improvements in querying our data in a real-time fashion compared to our legacy data warehouse environment, we found out that if we materialized these real-time queries into static versions, we could achieve speedups of 10,000x. The data designer does not have to build a model that has to address the usual size and speed constraints found in conventional data warehouse systems. But building these models flies in the face of traditional data warehouse construction techniques, which typically require designing a fact table of metrics (e.g., total tuition billed, total classes taken) one wishes to analyze at a predescribed level of detail (granularity) and several parsimonious dimension tables (to save on space and improve speed) that contain attributes like a student's chosen degree, home ZIP code, high school, and so on, in them. In HANA, our designers can combine a fact table and all the dimensions into one table, which then resembles a single bigger flat file one would create to bring into a statistic tool or a spreadsheet. Having such a flat model also frees the analyst from joining tables together and the issues that joins have, especially if the analyst isn't aware of the ramifications of certain types of joins.
Our teams had to go through three iterations of design in which we proceeded fairly far along and then had to throw away the initial work and reconstruct our models. We ended up with an approach that resembles object-oriented software engineering with more code reuse in mind than conventional data warehouse management methods. The models have a base of SQL code that models smaller components (e.g., classes a student takes, a student's basic demographic data elements) that are then used by higher-level SQL code, bringing these together into a large collection of fragments into a "super-query." The results of that super-query are then materialized for speed.
To get faster and faster performance, we adopted methods with less regard for HANA's stated intent of fast real-time analytics. We learned that no matter how fast the speed of improvement, we will always need more, forcing us to keep pushing toward the fastest designs possible. We have called for a process of painstakingly building many analytic models in this hierarchical, reusable manner distillation for a couple of reasons. First, it harkens us back to the process of making bourbon, a distinctly Kentucky product, and, second, it indicates that this process of developing highly usable models serves the analytic community. With a number of existing and new analysts across the university and lots of analytic niches to serve, we are currently and will continue to be pressured to extend existing models and add new models quickly. With SQL code reuse in mind, we didn't worry about a plethora of analytic models that might overlap. Instead, we promiscuously created analytic models to support very specific analysis use cases (we call them "vignettes") leveraging code reuse to mitigate overlapping or redundant models.
Had we known one and a half years ago what we know now, we might have shaved four to six months off our development timeline. But then again, that's the price of learning a new tool early in the tool's lifecycle.
What Did We Learn?
-
Don't be afraid to throw work away and start over, especially early in the implementation cycle. Be critical of your own inventions.
-
Don't drink the Kool-Aid. New technology is often not fully understood by everyone, even the inventors. Be practical in applying new technology. Don't be afraid of applying new, old, conventional, or unconventional approaches. Don't be too loyal to any single design approach. Be a pirate; that is, someone willing to ditch your trusted approach for a better one at a moment's notice.
-
Put IT experts from different backgrounds on the new technology initiative. Out of the different perspectives may emerge a very different and a much better approach that a group of like-minded individuals would have failed to consider.
ORGANIZING IT
New technology usually requires people to change how they do their work and how they organize. Just as the airplane had a dramatic effect on both the organization of armies and the techniques of warfare, so too would Big Data tools impact how we were organized. Like many universities, we had two separate and somewhat competing central units for supporting or conducting analysis. Our institutional research (IR) group, common today across most institutions, had its own separate data warehouse environment using an alternate set of technologies from a competing vendor. This environment was literally a clone of a good chunk of our operational data environment, copied nightly. The IR office had the responsibility for determining official enrollment and retention numbers and many other various university metrics reported externally to state and federal agencies. We also had a BI group that provided operational analysis tools for managers, most noticeably in the areas of budget and finance and the basics of student enrollment reporting. Both groups sought to be a one-stop shop for the university community in their original and increasingly overlapping missions. But both groups were not looking forward enough and did not have the skill sets to deal with an increasingly analytically driven higher education world. Moreover, only those who could understand how the mechanics of a disruptive tool could create new tactics would succeed in this transition. Internal conflict was inevitable. As we began to talk to other universities thinking about adopting these kinds of analytic tools, we saw that this IR/BI conflict was a common theme that prevented collaboration and the application of disruptive approaches. Since warfare is often merely ontological, we knew that a new way of organizing and analyzing data had to come forward and that new approach might require some to lose what they had honed for many years.
Late in 2012, these two groups were combined and along the way about a third of the 15-person group turned over, enabling the hiring of new skill sets. We brought in two new PhD-level data scientists and moved a PhD-track statistician all into the data scientist positions. These three data scientists, our IR director, and the leader of our old BI group now serve as the nucleus for a new IR office and our old BI group leader now leads an advanced analytics (AA) group that supports IR and the rest of the university. These two groups still offer different services but now operate as one unit. We are also in the middle of decommissioning the old IR data warehouse so that both the AA and IR units will rely on one source of truth. Since many of the data models are now unified and all separate models will be transformed into HANA models, all models will be designed to suit multiple goals within a single, flexible architecture.
The teams also worked on analyzing the skill sets required by the new tool and began a process of retooling individuals on the team so that everyone could participate. Fortunately, this particular tool, HANA, has a strong relational component and knowledge of SQL and relational data modeling was a critical and transferrable skill. We felt we had the skills to address the new technology.
This unification of both the architecture and the two analysis groups also helps with data quality. Data quality issues typically fall into two buckets. The first bucket is missing or holds incomplete data. For example, for many reasons, some of them reasonable, not all classes can have an instructor assigned until just before or after the class starts. Since prior cases of missing data were filled in after the fact, the up-front data collection processes were not providing high-quality data at the source. Now the teams are looking into ways of improving user interfaces so that missing or incomplete data counts decrease. The second bucket is in classification of data. Often different business rules require us to classify students differently. In the past, these rules of classification were within a particular data analyst's mind and not shared. The teams have documented many forms of data classification and codified the rules within some of our HANA models. Today we are examining ways of providing a general-purpose, iterative, rule-based query tool that can let us and other analysts create new classification rules without needing to change the underlying HANA models.
Now the teams are focusing on improving data quality within the originating business process where it is cheaper rather than at the final, more expensive reporting phase. Providing high-quality data is critical. If users can't verify the data by comparing low-level facts to their real-world experience, trust in the data will fall and use of the data will diminish. We hope our organizational model will provide natural incentives and good collaboration between team members to improve data quality.
What Did We Learn?
-
Many organizations will fail to apply new technology for purely organizational structural reasons. The "information is power" mentality often breeds in-fighting within units standing their ground, resulting in preservation of the status quo. Identify where new organizational combinations can result in a clear path for the new technology.
-
Keep an eye on transferrable skills when adopting new technology. When internal staff can reasonably learn new things, the disruption appears much more incremental and less fearful. New technology that allows for this rapid incremental evolution is the stuff of revolution.
-
Not everyone will make the leap. Be prepared to part ways where needed.
-
Data quality matters a lot. Unless the data quality is a top priority, the new technology can get quickly ignored.
HERDING CATS
Universities are distributed affairs. We are a loose collection of airplane parts flying in close formation. We are a random collection of buildings held together by parking lots. The only thing we can agree on is when to schedule the debate. Within university governance, a 100-1 vote is a tie. University politics are so brutal because the stakes are so low. We could go on and on.
The university's distributed nature comes from the nature of its offerings. Different degrees are taught in sometimes profoundly different ways, requiring deep expertise in a body of knowledge that nearly requires ignorance of other bodies of knowledge in order to become the master of one. Because of this, different parts of the university look at things very differently. Unsurprisingly, not everyone agrees on the way data ought to be defined and nor does everyone agree that certain data even ought to be analyzed. This diversity in even fundamental conceptualizations of the nature of organizational existence, while a source of strength in research and teaching, is also an accursed affliction when putting anything administrative into action.
To get the university to improve its analysis of data, we knew we needed a distributed and less conventional approach. Since for many, information is power and attachments to old ways of looking at things are often emotional, we would need to tailor our approach to meet the organizational and technical constraints of the various units we support. Our approach consisted of the following concepts:
-
Design valuable views for capable analysts. First and foremost, we believed that some colleges would be able to get some of their analytically talented faculty administrators analyzing data to support their planning needs. Universities, especially research universities, tend to have faculty with excellent quantitative skills who serve in administrative positions. Additionally, we have access to other administrators and graduate students who also possess analytic skills. We wanted to build something that takes advantage of this strength. So rather than design a traditional report using a centrally mandated tool, we developed a series of models designed to help the advanced analyst. We made these models available via direct data access (ODBC, etc.) so that these analysts could use whatever tool they wished. We remained agnostic on the front-end tool choice.
-
Avoid requirements gathering. Since a camel is a racehorse designed by a committee, we knew one of the surest ways of killing an initiative like this was to get a committee together and define requirements. When we started this process, our team was initially clueless about the real potential. Why would a committee be any better? Instead, we simply examined all the requests we received for analysis over the prior two years and developed models with data elements from those requests. Our approach was to include all data elements at the lowest level of detail; basically, nearly all of what we currently collect in our enterprise systems whether we thought the community needed it or not. We wanted to capture the maximum semantic complexity inherent within the data we store so that we can address most, if not all, future questions about the data.
-
Develop in an iterative, always-beta mode. Rather than use a project methodology with formal dates and formal requirements to be delivered, we immediately jumped into fluid, iterative sprints. We pulled together the analysts across the campus into a community of practice and let them know they will be seeing data as we see it, in all its naked ugliness, for better or for worse. In short, we weren't going to hide anything, and they would be watching us build the bridge as we walked on it. Fortunately, for many analysts in our community, this worked well and allowed them to give feedback to the teams and see their feedback put into designs fairly quickly.
-
Grow adoption via word-of-mouth, personal contacts. We also avoided public pronouncements and fanfare around the project. Instead we communicated to colleges and units via word of mouth and through the community of practice. We showed use of a particular tool (in this case, Tableau) analyzing the data. In just a few weeks, request for access shot up from zero to 90 users. Everyone who gets access also signs a pledge to be a good partner in the community. That pledge includes the following codes of behavior:
The purpose of these rules is to not comprehensively repeat policies, rules, etc., found elsewhere. Links can do that. The purpose of these rules of etiquette is to establish some common values and expected behaviors from various analysts across campus who will be participating. Your thoughts are welcome:
-
Be safe and secure. Respect the acceptable use of information policies and guidelines the university has in place. Please have good passwords and secure your laptop, desktop, and other devices appropriately. Treat private student and UK information appropriately.
-
Be collegial. University data is a community asset, and a community of people steward the data. Use and share the data with the best interests of the university community in mind. Since parts of our data analysis environment is designed to allow for greater transparency, analysts will potentially be able to see other unit data. While we will make private to a unit what absolutely needs to be private, the way the university runs its business often involves multiple colleges and units at the same time. Don't use your access to take unfair advantage of another unit.
-
Help improve data quality. If you see data that doesn't appear to be correct, let someone know. We have a team of staff dedicated to helping improve data quality. This team can work with colleges and units on any data entry and data management processes that might need to be changed to improve data quality.
-
Be open-minded and inquisitive. Data can be represented in multiple ways at the same time. While the teams take great care to enable multiple views of the data to support the community, you might have a valid and unique perspective. In time, we can accommodate more ways of looking at the same data while not interfering with other views or taxonomies.
-
Share. The main benefit from open analytics is the power of a community of analysts learning from each other rather than a few select individuals hoarding knowledge or access. As the community improves its knowledge and skill with the data, the university can improve accordingly.
-
-
Provide customized environments for colleges and units. Since each college varies in how it looks at teaching and research, each also varies in how it analyzes its data. Instead of battling this natural tendency, we embraced it. We started work on more traditional reports and displays for each college to have and keep separate. Each college will be able to change or add to its library of analytic objects as it sees fit. We will be developing performance dashboards for each college and are prepared to customize them for each college. This means we may have multiple competing classification schemes for data, such as a hierarchy of degrees, departments, and colleges. Rather than debate about which taxonomy will win out, we will accommodate multiple taxonomies side by side. This will let us see how diverse our university is in categorizing data elements.
What Did We Learn?
-
Big Data and other BI initiatives often represent opportunities for central IT units to impose a specific tool set and approach for analyzing data that independent business units despise. Rather than fight this tendency for business-unit autonomy, we embraced it with open access to data and front-end neutrality.
-
Build architectures that promote copying and reuse. In our case, creating a common set of analytic objects and reports that allow for customization by colleges helps us tailor the solution for maximum adoption. It increases the "surface area" of the data.
-
Engaging the community throughout the process helps us collect valuable feedback and build new designs quickly that the community then sees put into place. This also promotes adoption and, more importantly, a shared understanding between the analysis and model builders.
EYE CANDY
Our work has produced several analytic models to date. Each is designed so that an analyst can work with a single view and have all attributes needed for analysis (see Table 1).
Table 1 -- Analytic Models
|
Model |
Description |
|
Enrollment |
Specify class enrollment, midterm and final grades, credit hours attempted and earned, instructor teaching the class. |
|
Student retention and graduation |
Include student demographics and cohort identification (e.g., John Doe is in the 2009 entering first-year student cohort). |
|
Student demographics |
Include demographics such as age, high school GPA, entrance test scores (SAT, ACT), and subcomponent scores. Also, in a secure location, include additional personally identifiable demographic details such as name, address, email, etc. |
|
Student performance |
Present the enrollment data in such a way as to easily show the student's performance for each term, including credit hours earned, term GPA, cumulative GPA for that term, etc. |
|
Student academic career |
Keep a list of majors and minors for each student and degrees awarded. Also include details on students who transfer in and out, including transfer institution, credit hours transferred in, etc. |
|
Productivity |
The room utilization model contains every building/every potential classroom and lets users analyze the room capacity and enrollments for the class/event in room at five-minute intervals. The faculty stats-per-term model pulls together the number of students and sections taught per term and will contain other important data such as research expenditures per term and grant proposals submitted/won. |
|
Micro-surveys |
Capture questions and answers from the My UK Mobile micro-survey feature. |
|
Student involvement |
Specify interaction history with various applications, including learning management system, clickers, course capture and playback, academic alerts. Provide the basis for calculating student's K-Score. |
Since changing student behavior is critical for improving student success, we also have developed a new mobile application that replaces our first-generation mobile app designed and released four years ago. This new mobile application lets us capture more detailed mobile usage data and allows us to push micro-surveys (see Figure 1).
Figure 1 -- New mobile application to capture more detailed mobile usage data and push micro-surveys.
The new mobile app lets students access maps and university directory information, register for classes, pay their bills, view events on campus, and search the class catalog. The mobile app will also allow students to review their overall engagement with the university as measured by the K-Score. This metric is a single numeric score that essentially ranks students based on their level of engagement in whatever unit or container of engagement we may have. For example, each student's frequency of logins and types of interactions with our learning management systems are captured and scored. The K-score represents the student's rank in interactivity relative to his or her peers for each class, with a high score representing higher involvement. The K-Score also includes items like academic alerts that faculty and staff can enter when they identify a student struggling (see Figure 2).
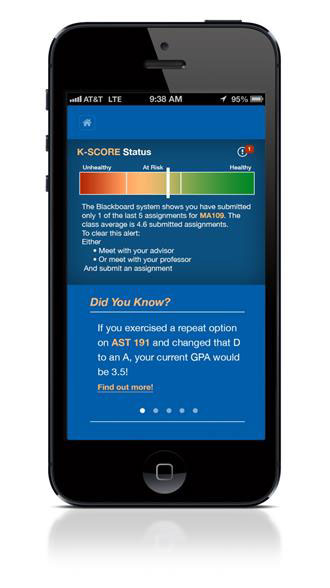
Figure 2 -- K-Score on mobile app.
As the student's K-Score moves up or down, we will be pushing personalized interactions to students using the micro-survey feature. Because the micro-survey feature is simple and engaging, student response has been high with more than 40,000 micro-surveys completed within the first six weeks of the features release. Response rates are very high with a high double-digit response rate. We are currently adding personalization technology in front of this feature so that micro-surveys can be sent out to small segments of students or even on a 1:1 basis.
We have also found new and rather mundane uses for HANA. We use its extreme speed to fetch data used for normal applications, such as our advising tool (see Figure 3). The speed of data retrieval is so fast that screen-to-screen refresh appears instantaneous. For advisors who need to use these tools while talking with students, this speed is critical. In general, the advising tools let advisors see all student information we have integrated as well as the student's K-Score.
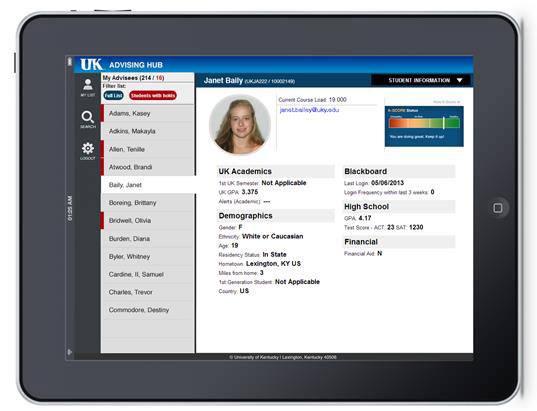
Figure 3 -- Other advising tool uses.
As one would expect, we have produced a number of workbooks and visualizations of operational data. Figure 4 visualizes classroom utilization, for example. Because of the new capabilities of our high-speed analytic tool, we don't have to reduce the data in size by aggregating it. In fact, we can do just the opposite. We can "explode" the data out so that although it presents much bigger data with many more rows (in our case, 150 million rows), it is much easier to visualize. In this case, we started with a rather small file that contains our class schedules for the term. Fitting within a rather large spreadsheet, but small by database terms, we took the class schedule and exploded it out into hundreds of millions of rows. Each row contains values for the building, the room, the date, the hour of the day, and each five-minute block of time. For each row, we include just a few numbers, including room capacity, number enrolled, and a few statistics about the student, such as whether he or she is a freshman, sophomore, junior, senior, or graduate student.

Figure 4 -- Classroom utilization example.
Since HANA compresses data so well, exploding the data out like this doesn't really impose a database speed penalty. As a result, our teams were able to easily construct visuals like Figure 4 within minutes. In the figure, you are seeing a one-week snapshot of a term schedule. Each row shows a particular room in a building and then shows each day of the week and increments for each hour of the day. The size of the square at the intersection of hour and room number represents the utilization. A large square means high (near 100%) utilization. A small dot means no use (0% utilization). A bright blue square means there are mostly freshmen in the room and a bright red square means there are only graduate students in the room. Colors in between represent a mix of students.
This type of view lets decision makers identify pockets of low utilization and make decisions for future planning without needing to look at numbers. Normally we would assign the task of pulling the data together and visualizing it to an analyst who would probably write some code to perform the transformations on the small selection of data requested. In this example, we are using the capacity in the Big Data analytic tool to create very large data structures that might serve no purpose other than for rendering visualizations.
What Did We Learn?
-
Big Data lives and breathes at the visualization layer. We separated out visualization of the data as a separate activity and have good information designers working on good visualizations.
-
There is a difference between actionable information and information in action. By applying analytics to personalization services and workflow applications, you can put information into action. Micro-surveys and personalization technology represent opportunities to have analytics working for students, one at a time.
-
Data models can be built and maintained just for ease of data visualization. This requires the data modeler to challenge basic assumptions about how data ought to be designed. Being wasteful in data structure size helps data visualizers quickly design interfaces.
FUTURE DIRECTIONS
So much more is ahead of us! With new technology like this, we are just scratching the surface. We have a number of ideas still percolating. One simple idea is to leverage our mobile application to automatically set alarms for students based on their class schedule (see Figure 5).

Figure 5 -- Leveraging technology in helpful ways for students: alarm example.
When we pitch this idea to adult administrators, a typical response is that students need to learn discipline and responsibility and we should not be spoon-feeding them. However, today's students frequently use their cell phone to set alarms. Why not make it easier?
Psychologists call the skill in remembering what to do next prospective memory. As with most things with human beings, we vary in our ability to remember what to do next. Some of us are good at it, some of us not. It might be possible for us to infer a student's prospective memory ability by analyzing his or assignment submissions or by asking the student some survey questions up front either as part of the mobile application micro-survey feature or through additional tests as part of the admission process. With a profile of the student's prospective memory, we can then do two things: (1) make that student aware of his or her ability and (2) help that student establish a reminder approach. While it would be nice to establish alarms right on the student's phone, we could also use technology to make calls for us with wake-up calls for students.
Prospective memory relates to other psychological indicators that aren't tied directly to cognitive traits (e.g., the ability to perform well on math problems or verbal problems). These are called "non-cognitive factors" and are often important predictors of student's potential for success. Things like curiosity, optimism, agreeableness, anxiety, and persistence can matter. Over time, we hope to help students understand their strengths and weaknesses and let them configure their IT tools to enhance their success.
Figure 6 illustrates a more complicated future scenario. Many universities today are recording instructors' lectures and letting students replay them back in their dorm rooms or in study spaces across campus.
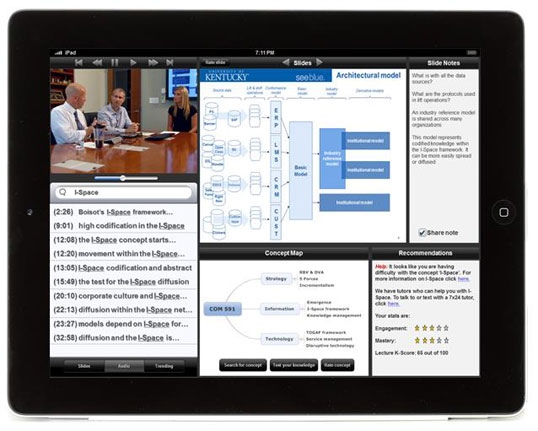
Figure 6 -- Lecture playback.
This has obvious advantages in that students can replay the lecture and especially the difficult part they failed to understand. Our own internal research with medical students shows that lecture-capture tools may help grades a little bit and they certainly positively affect student satisfaction with the class. With Big Data tools, we think lecture capture can go further.
First, audio can be converted automatically to text (we have tested this out with Microsoft services, but YouTube and other service providers can do this as well). Second, all course content, including instructor slides, can have the text extracted. All this text can be mined and key concepts can be lifted out of course content. Some of our architects have been prototyping solutions for this. Once key concepts have been identified, we can display a map of concepts to the student, letting them navigate the lecture more easily. For example, if the student is in a physics class and is learning about entanglement in quantum mechanics, the student can search lecture and class notes and slides for all references to the concept "entanglement." As the student does this, we can begin to measure student involvement with critical class concepts. We can than work with the instructor to create mini-tests that can assess student mastery over these concepts.
Scaled out to dozens of sections of physics classes across a modern university with 1,000 students in those classes, the department chair can then watch on a day-by-day basis which students are having trouble with what concepts. Borrowing from examples like Kahn Academy but using Big Data analytic tools, we feel it is now feasible to efficiently distill this kind of useful information about one important aspect of student learning without consuming too many staff and faculty hours.
As students interact with such a tool, the Big Data analytic environment can quickly infer what the student is struggling with and trigger a variety of interactions, such as sending links to other content and information, providing tips on tutoring services, or letting students call a peer mentor (another student paid to help other students) right at that moment. While potentially crossing over into the land of "creepy," such a system could alert a more experienced student peer tutor who would then call the student's cell phone and ask, "John, it looks like you are having trouble with the concept of entanglement. I can help you with that."
While initially sounding eerie, we point out that it might not be if the university offers this as an opt-in service to students. Think of it as just-in-time predictive tutoring. Such an arrangement can have multiple benefits. Not only will the younger student engage in such a service be helped, but we can identify those juniors and seniors who are struggling to make ends meet as they complete their final year or two and give them stipends that keep them in school and graduating. We can automatically connect these more advanced and capable junior and senior students to the freshman and sophomore students rather than segregating the student population into two groups that don't get much chance to interact. When students further behind interact with students further ahead, this helps the students who are further behind.
Other ideas percolate. We are experimenting with social media listening tools where we can identify social media identities in LinkedIn, Twitter, Facebook; correlate them with our existing list of students; and start enhancing our understanding of the student to capture his or her interests as expressed in public social media. We can also deliver support directly to the students in their social media channel. For example, with social media listening tools we can find the student who tweets "My dorm roof is leaking!" with a direct message that says "Help is on the way!"
As Big Data analytics advances and becomes more affordable and commonplace in universities and companies, these and many other ideas can come to life. They will challenge organizations at different levels. In higher education, us older adults frequently misunderstand and misinterpret the younger generation's use of technology. Our own "sticky mental models" sometimes get in the way and prevent us from conceptualizing solutions correctly. Issues about privacy, security, personal responsibility, and crossing the line into creepiness pop out. Faculty and staff can be threatened with this kind of technology, which can potentially automate many activities in higher education.
But these challenges are also opportunities. We believe that while we can automate many activities that staff and faculty currently perform by leveraging Big Data analytics, there is so much more for faculty and staff to do that only they and not a computer can do. Walking through this transition won't be easy.
Thus, to keep up with current and future analytic demands, our "open data" approach brings the opportunity for internal crowdsourcing methods. For example, we can publish all the analysis and research the institution would like to do and let colleges "bid" on the work, should they find the work of interest and valuable. We have already started working with faculty who are using the data for bona fide research and are curious as to whether faculty on sabbatical or during the summer might apply their analytic abilities to problems within the university. We are also collaborating with our main vendor, SAP, on just such an idea, but applied to analysts across the globe. We can take some of our research and bid it out in an open crowdsourcing environment or exchange. While SAP is working on the legal, intellectual property, and security concerns in such an environment, other sites like Kaggle have indeed begun crowdsourcing analytics.
What Did We Learn?
-
When envisioning the future, bring the student in on the process. We engaged our student population in the development of our mobile platform and received valuable feedback for our K-Score and the overall suitability of the tool. What we learned did not match our expectations. We thought that students would not appreciate us having this data or offering these services. The student reaction was interesting. One student said, "You mean you have this data and you haven't been helping me?" Another quipped, "I wish I had this as a freshman."
-
Organizations need to find ways to adequately engage their key people, whether they are managers, front-line employees, or in between, so that the visioning of the future is open enough. In order to build the future, you must build a bridge to the past. If the visioning is done too much behind closed doors, you can leave key leaders behind.
-
A big vision requires partners. In our case, we are partnering with Coursera, a leading MOOC (massive open online course) provider and hope to someday provide personalized learning interactions in these kinds of environments. We are also partnering with a few important academic technology vendors, such as Dell, SAP, and Echo 360, to see how we can project our Big Data services into their user interfaces. This can challenge some vendors, so selecting vendors that share the same vision matters.
WE ARE AT A CROSSROADS
Despite being the first in higher education to adopt this kind of technology and despite our progress so far, we are still far from our goal and have been considering revisiting basic assumptions that guided the first one and a half years of development. While we have enabled access to good analytical models, we have more work to do on dashboards and visualizations and little time. We also have to let a few years run by to see what impact all this analysis may have on university expenses, revenue, and competitiveness. For the next few years, we will need to rely on our "gut feeling" and more provisional measurement models to determine if we will be effective in this transformation.
We also have before us a new budgeting model in which colleges will have their own income statements and will have the ability to use additional "profit" generated within their college. We are already seeing a significant increase in analysis related to revenue, student retention, and overall productivity even before this transformation takes effect. This transformation will generate organizational demand for analytic models. We are also at the beginning of a large and encompassing strategic planning process that will involve six work teams and as many as 100 faculty and administrators in a year-long process. These work teams will be requesting both simple and more intricate analysis to guide their strategic planning processes. Supporting these processes may interfere with completing better self-service analytic models and tools.
The teams have been feeling this pressure and are starting to grow weary of the breakneck pace. While the teams have kept pace with demand, we wonder when we will cross over into a more stable rate of expressed demand. In addition, the current word-of-mouth approach is getting perhaps too successful as others want more formal communications and want to catch up to early adopters. All this creates questions that we have been pondering:
-
How would we measure this technology's ability to impact our advising and teaching processes?
-
Analytic work like this takes effort that other universities might not be able to expend. Should universities cede the analytic core competency to vendors?
-
Is knowledge of what works in teaching a private or public good? Should we (and vendors) share our findings?
-
Will crowdsourcing methods for conducting our analytics work? What impediments are out there?
-
How do we grow analytic skills internally with such a shortage of skills?
-
Should we switch gears from an always-in beta, informal marketing and release model with a more formal product release method?
THREE BIG QUESTIONS
About one month ago, Stephen, Adam, and I met in the local eclectic coffee shop to discuss where to go next. Our conversation wound up by reducing down the issues to three big questions.
-
Question 1. Since the start of the project, some key analysts in different units on campus have resisted, usually quietly, using the new HANA data warehouse. Early on, some staff in one key unit resisted strongly and lobbied for its own alternate architecture, leading us to chalk up the fight to the "information is power" bias. In this case, this analyst had to maintain control over the tools of analysis. However, as our IT units reorganized, that resistance left with that staff member. That experience heightened our awareness: as we continue to introduce these tools to new units on campus, analysts in those units that have built their own means of bringing data together and have established their own clientele will be understandably threatened. We discussed producing some materials that describe the value of these analytic tools as well as the benefits that can bring to these resisting units. Is this the right approach or should we have some deeper conversations with the top leader of that unit (in this case, the dean or VP) instead? Are there other issues causing passive resistance lurking below the surface of what we see? How can we get ahead of the organizational change management issues?
-
Question 2. Very recently, we have been experimenting with a new feature in our mobile phone app, which lets students "check in" at events without using location services, thus vastly simplifying the technical approach. We have found a way to tap into our WiFi network infrastructure to keep track of movements of WiFi devices across campus. If students use WiFi to connect their mobile phones (nearly 60% do), we will know what building and floor the student is in and the current time when he or she checks in. For more stringent check-in control, such as class attendance, we can produce codes that faculty can announce at the beginning of class, thus limiting check-in to those students in the class. This prevents one student from notifying a bunch of other students back in the dorms of the code for check-in, since the code has a limited lifespan (15 minutes) and is restricted to a building and floor. This widespread and general-purpose check-in data as well as the WiFi logging data gives us the unprecedented ability to monitor student movement providing numerous safety, class planning, and measurement of student engagement benefits. We are also experimenting with one of our technology vendors on more sophisticated ways of mining social media data to uncover students with interests in, or deep problems with, the university. Such social media mining can correlate disparate pieces of social data in ways not previously possible. All of this opens the possibility of unintended consequences. How can we deliver services based on this data without being creepy? Do we have an obligation to mine this data to prevent an unfortunate event or crime on campus? We are considering putting together a panel of students to weigh in on the issues and are considering an administrative governance group to ponder the issues. However, after talking with our campus police and PR departments, we have a strong public safety need to monitor this kind of data. What are some ways to bring groups across campus together on this difficult and important issue?
-
Question 3. In our coffee shop talk, we were concerned that perhaps we are moving too fast for the whole campus. While our work was recently highlighted in higher education trade press and discussed with favorable feedback from our board of trustees, we are starting to get the uncomfortable feeling that interest in these techniques outside our university is greater than inside the university. Are we an example of a central IT unit and a CIO going too far too fast? While each of us believes these services are important for improving student success (and our student panel that advises us agrees), not everyone across campus does. Some faculty and administrators believe we should not be spoon-feeding students with some of these services and that we should not be replacing human-to-human interaction with more human-to-computer interaction. Not all leaders across campus have spent the time learning about, and reflecting on, the types of technologies discussed here or their implications. In many ways, those of us closest to the new technology are further along in this process than many of our peers across campus. Do we slow down to let them catch up, or do we continue with leading-edge adoption working with some of those colleges and units are at the vanguard?
And so we ended yet another coffee shop conversation with more questions than answers -- and more work to do.